Over the weekend, I saw so many bullish tweets about the stock market.
The authors of those tweets shared charts with fancy analysis techniques and facts about positive seasonality.
They mainly used daily charts from several weeks ago.
Also over the weekend, we at MarketGauge listed all the issues the stock market is currently having.
A brief list:
If the Federal Reserve becomes more dovish-what’s the result?
A declining dollar-what are the implications?
Foreign countries no longer buying of buying less of U.S. debt-what does that mean?
The extremely high U.S. debt and how that breaks down among students, household and car buyer’s – debt a problem?
The market can bounce. It often does during massive corrections and bear phases.
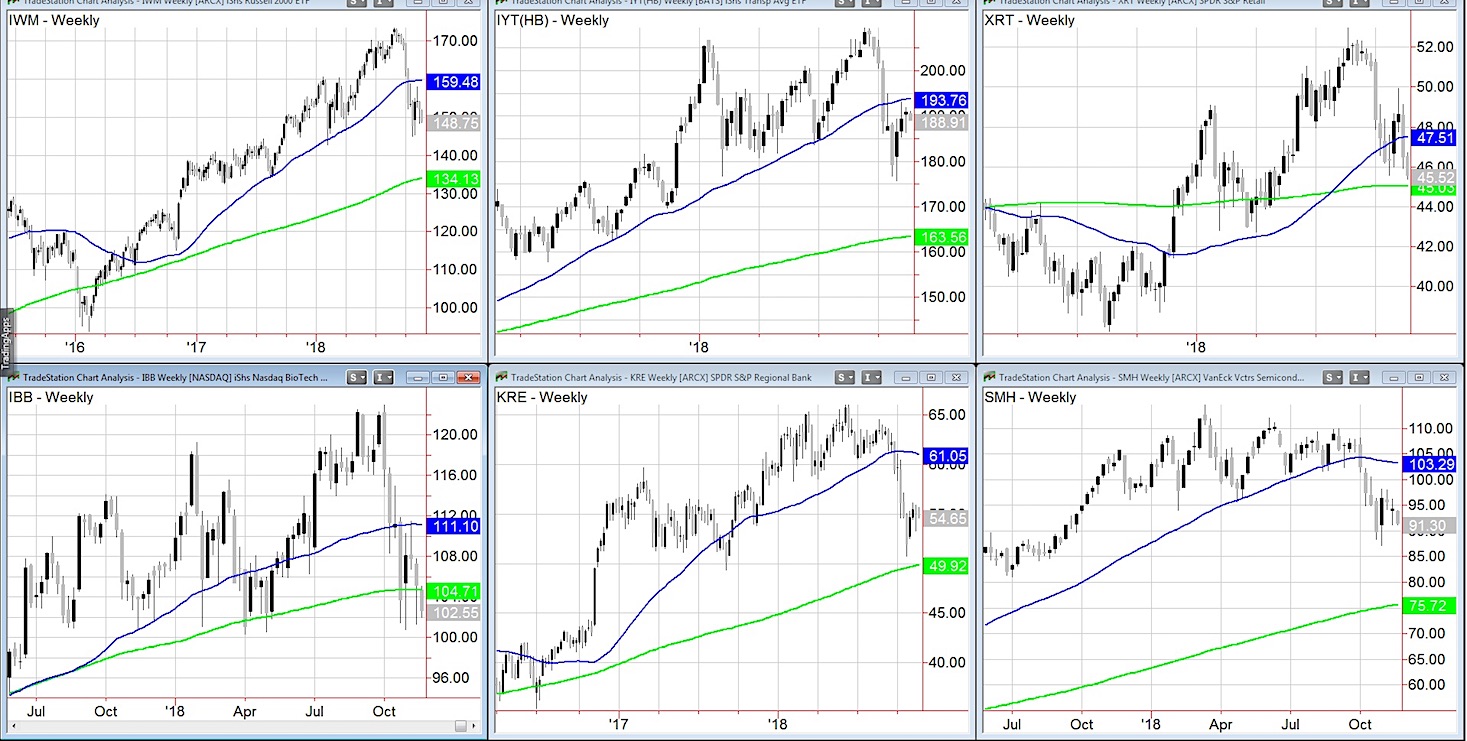
However, if we look at the weekly charts, are there signs that a bounce can sustain?
On the weekly charts since last I posted, things have deteriorated in the Modern Family.
The Russell 2000 broke 150 today. Even if it clears back over, the resistance overhead (around 160) seems unlikely to clear.
The Transportation Sector IYT, has seen the slope on the overhead 50 WMA decline.
Going forward, this is still the best place to watch for any strength. Especially if it gets back over 194.
Retail XRT has broken the 50 WMA and sits really close to the 200 WMA at 45.00. Given seasonal factors, this does not look good now.
Biotechnology IBB, has a lot of support around 100, but is trading under a declining 200 WMA.
Regional Banks KRE, if there is a Santa, can rally to 60.00. More likely though, is another visit to 50.00.
Finally, Semiconductors SMH, could see 85 before it sees 95.00
With 2 days before Thanksgiving and many of the Black Friday deals already available, the market does not appear too optimistic.
Nonetheless, always keep an open mind, and more importantly, always have a sound trading plan.
Trading levels for key stock market ETFs:
S&P 500 (SPY) – Recent low 259.85. Last week’s low 267. Resistance at 270.
Russell 2000 (IWM) – 150 pivotal. Recent low 144.70
Dow Jones Industrials (DIA) – Unconfirmed Distribution Phase-250.95 the overhead 200 DMA
Nasdaq (QQQ) – 160.09 recent low. 163.45 Resistance
KRE (Regional Banks) – 55 is the pivotal number.
SMH (Semiconductors) – 86.95 recent low. 94.50 major resistance
IYT (Transportation) – Holding 186.50 with 190 pivotal resistance
IBB (Biotechnology) – The 200 WMA at 104.75-now resistance
XRT (Retail) – 45.00 the big support this must defend.
Twitter: @marketminute
The authors may have a position in the mentioned securities at the time of publication. Any opinions expressed herein are solely those of the author, and do not in any way represent the views or opinions of any other person or entity.


