 By Alex Salomon
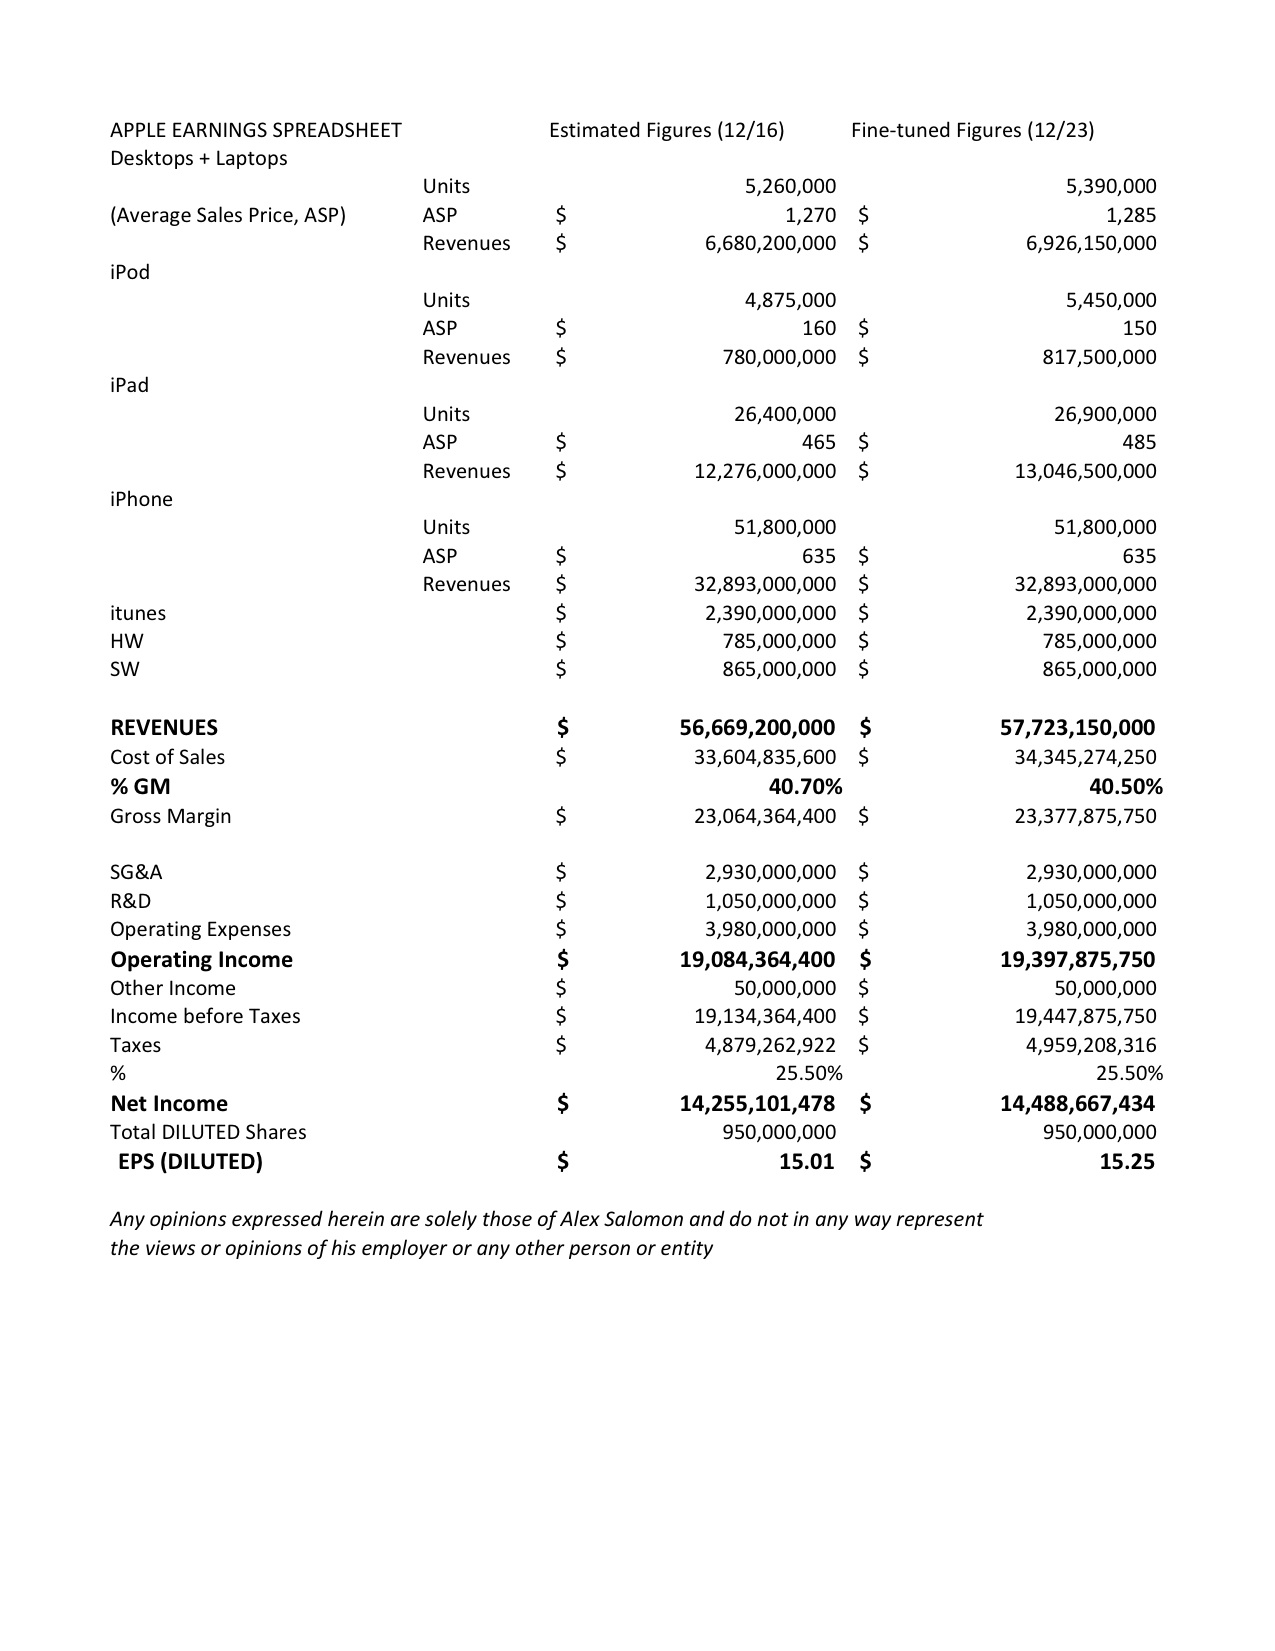
Last week, in the column “Revisiting Apple’s Stock” I offered a few thoughts on Apple and a modelization of the company’s upcoming earnings, for the 1st quarter of 2013 (due on January 22, 2013). I also stated that I would try to go under the hood and defend my numbers: So let’s get into the meat of it all and provide further detail to the numbers in the Apple earnings estimates preview.
Note that next week I will go into price targets for the stock itself.
There are really 2 tasks at hand, one easy and one more difficult. The easy part is modeling iMac, iTunes, SG&A, shares outstanding, etc. These numbers do not have wild swings and are fairly easy to predict. While they represent a significant part of the models, their overall effect on EPS remains steady and less influential.
The more difficult task is to gauge the overall iPhone, iPad and gross margin figures. These three factors (and corresponding ASP, “average sales price”) are at the heart of financial models for Apple and quite difficult to anticipate. Yet these numbers are also at the heart of the Apple chase and frequently monitored, covered, reported (see, for instance, Forbes coverage of analysts covering Apple & the accuracy of their projections).
Please note, despite my best attempt, and a fair amount of time spent, I have been unable to find “whisper numbers” for the upcoming Apple earnings estimates. I have found some individual articles covering expectations of analysts, but I could not find a synthesized table such as the one linked above. Not yet, at least.
So, for the time being, I am on my own!!
Let’s quickly go over the “easier” stuff:
1) Desktop & Laptops: 4.92MM were sold in Q4, there has been a 15% QoQ seasonal increase in laptop sales and some strong YoY historical patterns, along with a gently descending ASP.
Considering the release of new MacBooks and iMacs and an overall robust Thanksgiving season, coupled with the anticipation of a strong Christmas season, I tabled on 5.26MM units. I actually believe my number to be slightly too conservative and it could surprise a little on the upside.
2) iPods: might actually spike a bit due to seasonal Holiday shopping, but pricing is eroding. I am retouching these figures a touch, but again, the effect is minimal.
3) iTunes, Hardware, Software: some spikes here (thanks to gift cards for Holidays, change in the charger gadgets for the new iPhone, etc. but again, the effect is minimal).
4) SG&A, diluted shares, tax rates: these numbers are pretty easy to extrapolate from historical patterns and will not considerably affect the financial projections.
Now let’s attack the “tougher” segments:
1) iPhones: I have to go by with the scarce information available! Initial sales after the iPhone5 release in September (5MM units), the Chinese sales (2MM), the Brazilian sales (1.5MM with TIM alone); the US carriers and iPhone market shares; the US carriers and overall iOS market share; the overall iOS market share… It is like hunting for eggs!
I have to extrapolate sales by carrier (for instance, AT&T guiding to sell 9.2MM total phones for Q4. But are they sandbagging their guidance? Could make that 10MM?).
Add Verizon, Sprint, the iOS market share…
Then it’s time to look at historical trends of sales by world’s region and to scan the web for headlines on the launch of the iPhone 5 in Brazil, China, Indonesia, etc. (the fun part is to read about international carriers, like SingTel, TIM, KDDI, Telstra, Orange and many more!).
It is quite difficult to wrap one’s head around all the numbers but all news checks seem to point to a blow out iPhone 5 release coupled with steady iPhone 4(S) sales.
All in all, I believe we could see 35MM units in the USA and EU, and Japan & South Korea had close to 1MM combined on release, China had 2MM units 3 days into the launch, Brazil had 2.5MM units also a week into the launch. Extrapolating sales from mid-December (the week of Dec. 14-21 at about 7MM units for larger markets, so I will expand it to 11MM by year-end), adding smaller countries (Australia, Chile, etc.) and I am sticking to my figure of 51,800,000.
2) iPads and gross margins: basically, I had to use a similar methodology on these other 2 critical segments! I had to search for news and press releases on iPads.
The main item affected by finer research is a constant string of entreprise/corporate adoption rate. Therefore, I am adding a little bit to my sales figures.
I won’t bore you and repeat the madness behind the excercise: it is a repeat of what I had to do for the iPhone.
All in all, I added almost $1B from last week’s preview, mostly based on fresher news… all the while, most analysts have grown more bearish, so I am definitely going against the tide! (swim with me at your own risks!!).
This should wrap up the series on the Apple earnings estimates and EPS preview with components.
My last stop, next week, will be setting price targets and sharing ideas based around my EPS model.
Until then, Merry Christmas and happy holidays to everyone. Have a wonderful, blessed Holiday! Thanks for reading!
Twitter: @alex__salomon @seeitmarket
No position in any of the securities mentioned at the time of publication.


