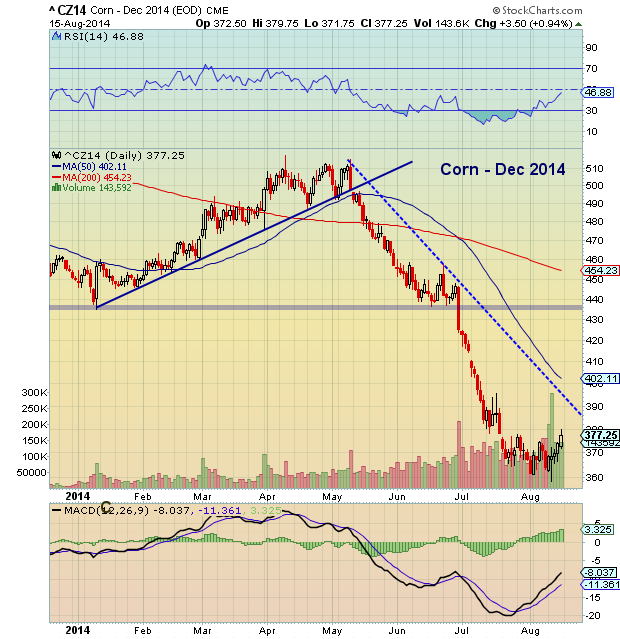
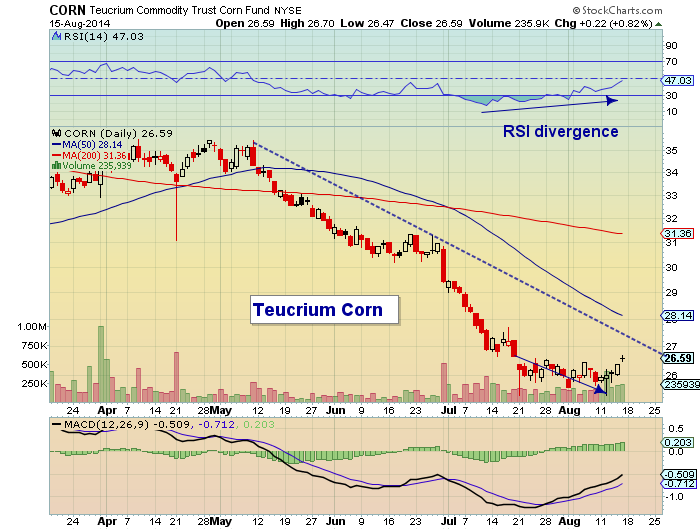
 Lots of interesting dynamics at play for grain commodities right now. In short, the past 3 months haven’t been kind to Corn, Wheat, and to a lesser extent, Soybeans. But each of them is trying to put in a bottom. Corn in particular has struggled to gain traction, but perhaps the sideways price movement that forms a rounded bottom is part of the frustration that wears out investors and sparks a corrective move. Either way, the setup is there and has potential.
So what gives this trade potential? Well, prices saw a deep move lower on the Relative Strength Index (RSI) which included an RSI price divergence (higher relative strength, while price continued lower). This is usually a near-term bullish indicator. As well, there is a rounded bottom formation. This often serves as a nice base for a trade (and risk/reward setup). That said, retests (and undercuts) are always possible in bottoming formations.
Below are charts for December Corn prices and Teucrium Commodity Trust Corn Fund (CORN). Since the charts are annotated (and pretty similar), I’d like to simplify things and focus solely on December Corn. Near-term resistance resides around 3.90-3.95. This is also near the .236 fibonacci retrace level (3.93) and the falling 50 day moving average (4.02 and dropping). A decisive move above 4.00 would likely spur a move to the open gap between 4.10 and 4.15. Above that is lateral resistance around 4.35/4.40.
December Corn Prices Daily Chart
Teucrium Corn Daily Chart
Note that this analysis was done with a shorter-term lens and that the wider lens primary downtrend is still in tact. Trade safe. Thanks for reading.
No position in any of the mentioned securities at the time of publication. Any opinions expressed herein are solely those of the author, and do not in any way represent the views or opinions of any other person or entity.


