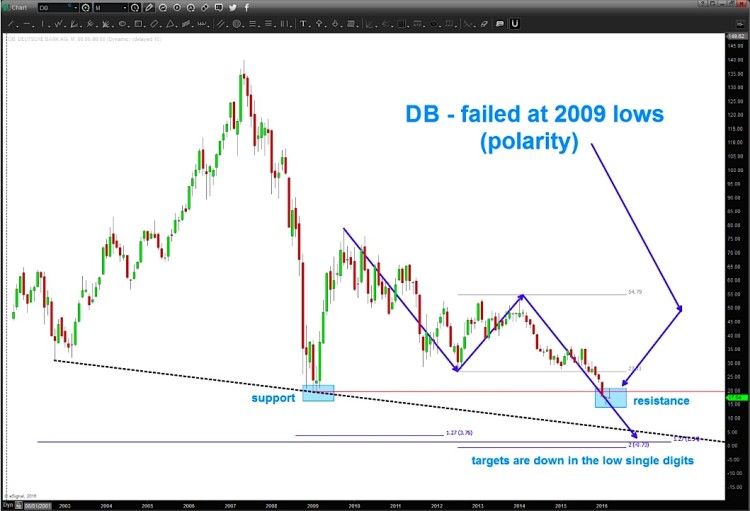
Deutsche Bank’s stock price bottomed around the same time as the broader banking sector (early to mid February) but its recovery has lagged the sector. And there may be a reason for this.
Deutsche Bank (DB) has been a stock laggard for some time as it attempts to overcome balance sheet concerns. A broader picture (i.e. chart) shows us that its troubles could drag the stock lower yet.
In the chart below, you can see the idea of polarity playing out. Here, prior support is transforming into resistance. And the longer DB remains under $20-$21, the more likely it is to follow the chart pattern lower.
Perhaps much lower.
Looking at the chart below, and considering the chart patterns, it is my opinion that Deutsche Bank’s stock price could fall into the low single digits. This may seem like a long shot from here… so perhaps its best not to think about the targets but to simply understand that there may be more risk in this one. I believe that chart patterns can help investors navigate risks while weighing probabilities.
Take GoPro (GPRO), for example – it fell from $98 to the single digits (all chronicled here on See It Market).
I’ll be watching the $20-$21 level as resistance on $DB. The longer price holds under that level, the more likely DB is to make new lows…
Deutsche Bank ($DB) Chart
Thanks for reading.
Further reading from Bart: “Is A GoPro Stock Bottom Finally In?“
Twitter: @BartsCharts
Author does not have a position in mentioned securities at the time of publication. Any opinions expressed herein are solely those of the author, and do not in any way represent the views or opinions of any other person or entity.


