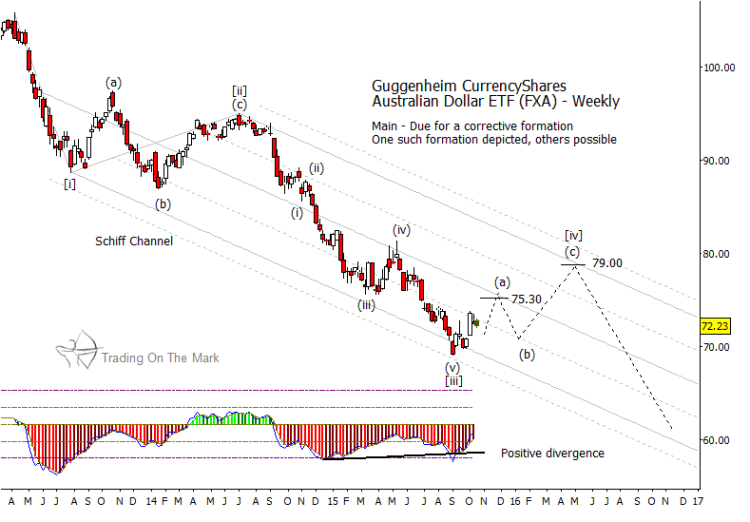
We often see forex charts moving in opposite directions to the U.S. Dollar, but there may be an exception this autumn for the Australian Dollar. Here we chart the Guggenheim CurrencyShares Australian Dollar ETF (FXA), and we believe it has farther to rally between now and December. Moreover, it appears that it could drift generally higher until the middle of next year, although the pattern may be choppy.
Our post here on See It Market last week showed a likely path for the U.S. Dollar as reflected in a popular, related ETF (UUP). The important message from that post is that we expect the U.S. Dollar to remain within a range while it works through a corrective pattern between now and early or mid-2016. We do not expect the U.S. Dollar to resume its strong trend upward just yet, and that rangebound behavior should produce non-trending moves in paired currencies. And that may bring short-term trading opportunities.
With the Australian Dollar ETF charted below, we note that it has made a strong, five-wave (i)-(ii)-(iii)-(iv)-(v) move down from its high of early 2014. That type of strong move is characteristic of either a third wave or a ‘C’ wave, either of which should be followed by a sizeable countermove. We lean toward assigning third-wave status to the decline from last year because economic considerations in the Pacific region suggest the Australian Dollar should eventually go lower.
Therefore, under that scenario FXA should find a way to trace a generally upward corrective move that is proportionate to what we have labeled as wave [ii] on the chart.
This does not mean we expect a strong FXA rally. A corrective pattern during the next six to twelve months could expend its energy by moving upward into resistance or by moving sideways. In the case of the Australian Dollar ETF (FXA), the Schiff channel we have drawn on the weekly chart shows some areas to watch as potential resistance. Both the center line and the upper boundary of the channel provide a way of visualizing how the location of resistance is related to both price and time.
In the near term, it may be possible to make relatively quick upward trades on small pullbacks until price reaches the vicinity of 75.30. For traders who are not watching daily charts, a better move with the Australian Dollar ETF (FXA) might be to wait for a larger pullback late in 2015 or early in 2016. One could then trade the move until it approaches one of the resistance targets.
Traders should think of resistance targets as approximate. Some areas have a higher probability of being reached than others, and the chart geometry that we find with tools such as the Schiff channel can help discern the location of resistance as a function of price and time. In combination with geometry, the Fibonacci retracement values at 75.30 and 79.00 show some areas to watch as potential resistance strictly on the price axis. Bringing the two methods together results in a “road map” that shows how the expected corrective move could trace a generally upward (a)-(b)-(c) pattern into 2016.
Another development that might throw traders off the trade would be for FXA to make a lower low with the forecasted wave (b). That development would not invalidate the pattern, but it might lead some traders to conclude that FXA was preparing to dive beneath the lower boundary of the channel. We believe that type of dive is unlikely. Instead we would view a modestly lower low in coming months as a platform for the Australian ETF (FXA) to bounce.
Later this week, we’ll present readers at See It Market with a forecast for crude oil prices as reflected in a popular ETF. Stay tuned! Also, let us know if you would like to receive occasional big-picture analysis and perspectives delivered to your inbox every few weeks.
Twitter: @TradingOnMark
No position in any of the mentioned securities at the time of publication. Any opinions expressed herein are solely those of the author, and do not in any way represent the views or opinions of any other person or entity.


