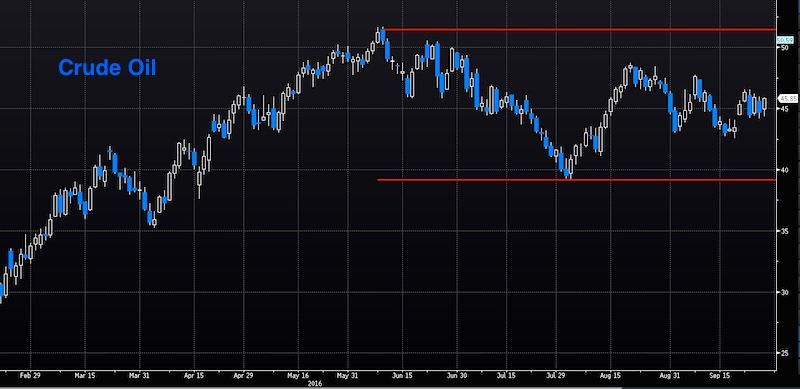
Back in May, I offered up a macro technical outlook for crude oil prices. In that blog post, I discussed why oil prices were looking very extended and were due for a pullback. Shortly after the article, crude oil prices peaked and pushed down below $40 a barrel (a 24% correction).
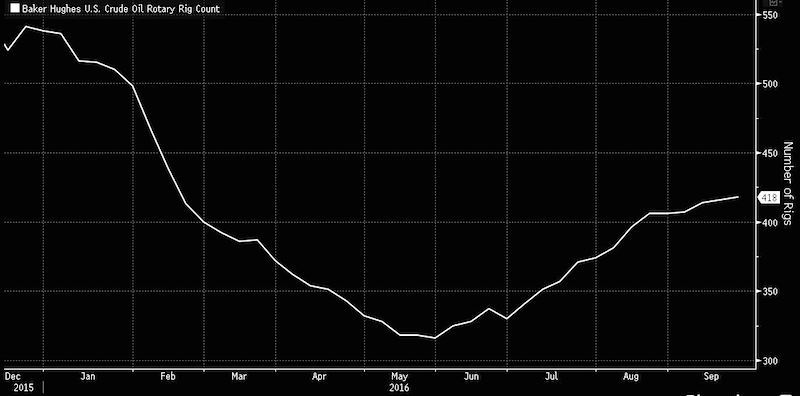
It now seems that prices are stuck in a wide trading range ($39 to $51 a barrel). Today I want to share a couple of charts that support that thesis: one technical and one fundamental.
Let’s take a look at the charts. The first one highlight the crude oil trading range since May.

Alex Bernal posted an excellent chart highlighting near-term price compression as a reason why a trend link move may soon develop. The chart really shows the indecision oil traders have been experiencing with such a tight range the last few weeks.
While nothing fundamentally has changed for crude oil prices, oil inventories still remain near record levels and OPEC continues to pump at record paces. Rig counts (418 total rigs) continue to expand after putting in a floor in May of this year.

I believe oil prices will be stuck in this range ($51-$39) for some time unless there is a major catalyst to drive the prices higher. OPEC has another big meeting in November that may provide more clarity if/when countries may cut outputs. Expect a lot of volatility in oil October and November with headlines pushing the price all over the place.
Also read: Crude Oil Trading Update: Compression Signals Coming Move
Thanks for reading.
The material provided is for informational and educational purposes only and should not be construed as investment advice. All opinions expressed by the author on this site are subject to change without notice and do not constitute legal, tax or investment advice.
Twitter: @stockpickexpert
The author or his clients may have positions in mentioned securities at the time of publication. Any opinions expressed herein are solely those of the author, and do not in any way represent the views or opinions of any other person or entity.


