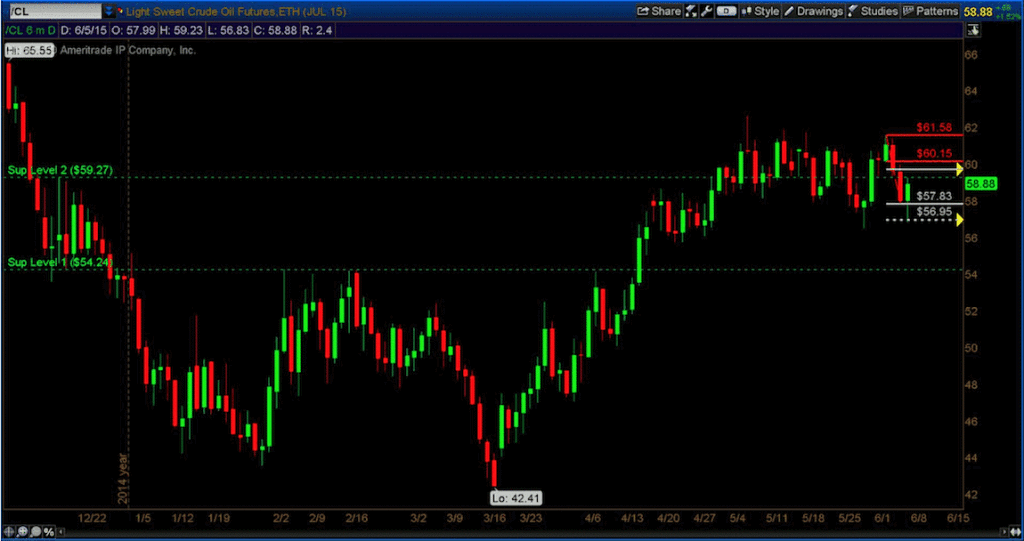
Crude Oil prices have been a great exercise in patience, risk, and discipline. Seven weeks ago, I highlighted a short term target of 58.25, as well as several technical support and resistance levels for Crude Oil. One of those resistance levels was 59.27 and this level has proven to be an area where crude oil prices have turned sideways (perhaps a consolidation zone).
Although we are still waiting for further developments to get a beat on Crude Oil’s next move, below is a current look Crude. Compare the previous chart with the one below. You’ll see how price continually gravitates to the 59.27 support/resistance level. Click charts to enlarge.
Crude Oil Futures Chart – 2015
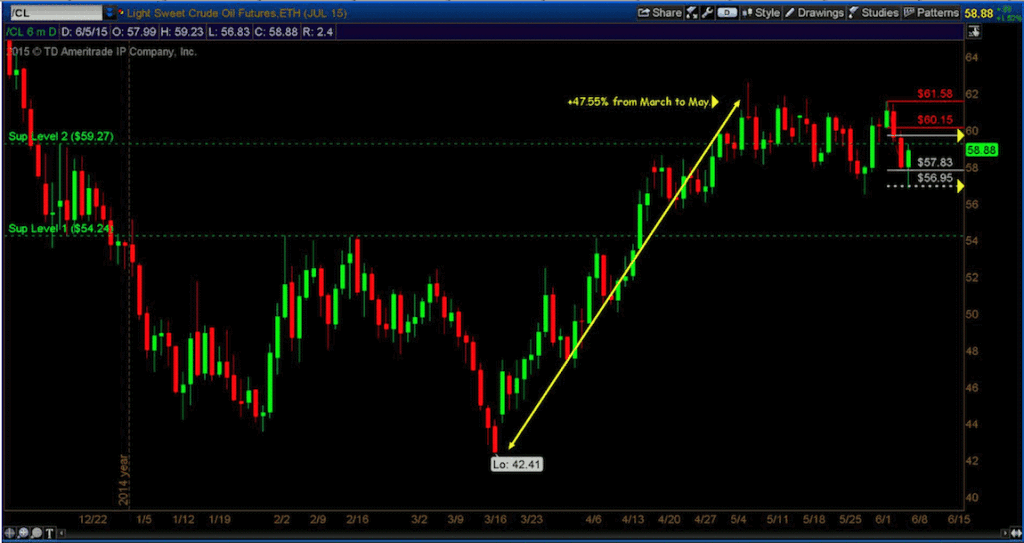
Now let’s go back a bit more to December of 2014. In that article, I highlighted a downside target of 45.46, which was hit, and in January 2015 another downside target of 43.67 was projected and hit as well.
In the chart below, you can see Crude Oil prices went on to make a low of 42.41 in March, 2015 before moving up a respectable +47.55% to a high of 62.58 in May.
Crude Oil Futures Prices – March Low/Rally
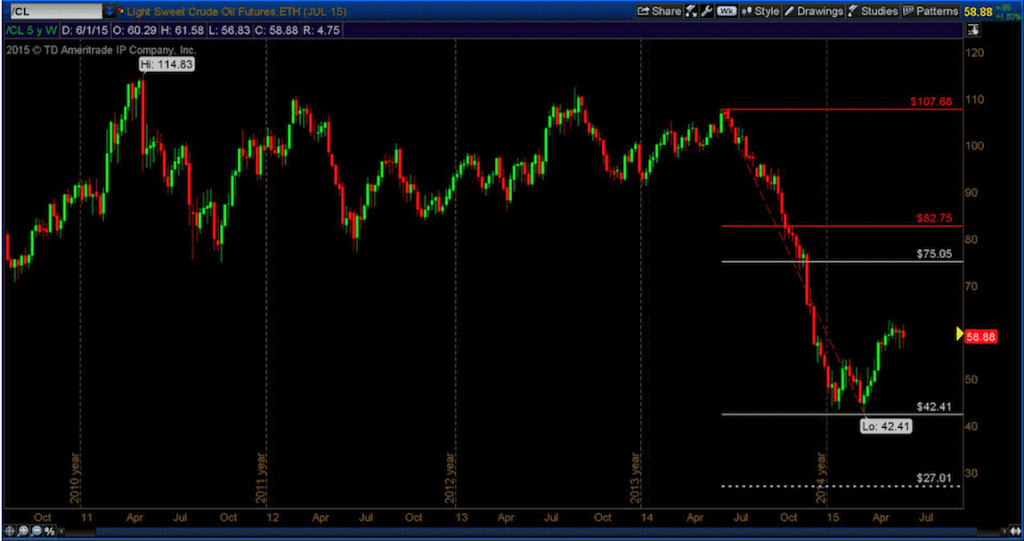
So, where is price headed? Let’s see what the chart tells us. Starting with a multi year weekly chart, the first thing I want to identify is the first area of resistance, which is 75.05. Crude is currently at 58.88 or 27.46% below that. This also gives us a downside target of 27.01 which is (54.12%) below current price. Those are some very wide spreads and this should only be looked at from a long term investment point of view.
Crude Oil Futures – 5 Year Chart With Fibonacci Targets
At this point, the only way to really play this is drawing smaller fibs inside of the one large fib until either 75.05 is hit or the target is hit. In my opinion, crude will, at some point, move back to 75.05. This is where you’ll want to watch for continuation or a strong rejection. Price also needs to move out of the consolidation range it’s currently in to give us more clues as to long term direction.
I’ll continue to chart Crude Oil futures on a daily basis and post charts as levels change. You can also visit my site for more information on drawing Fibonacci levels.
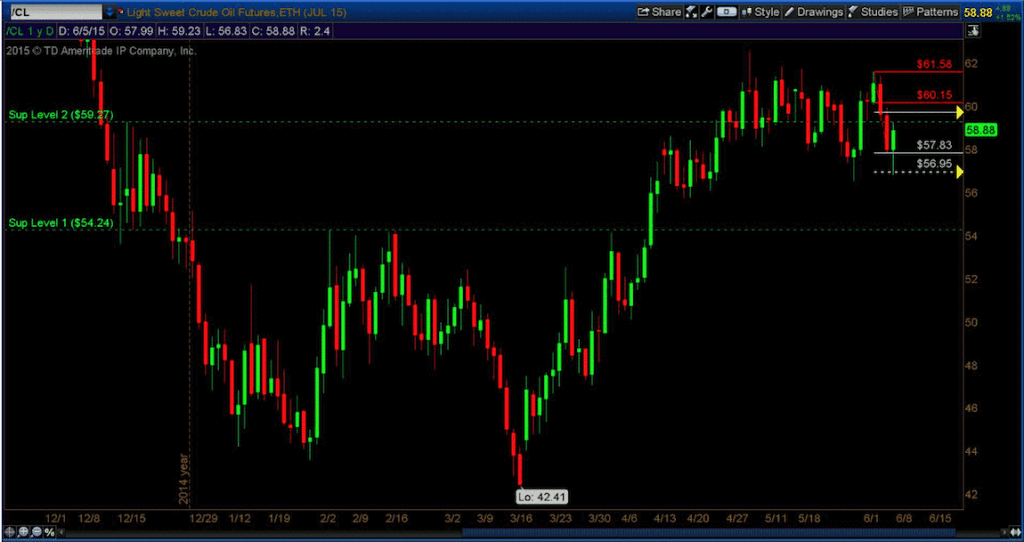
Currently, I have a downside target of 56.95 which was hit Friday, June 5th, 2015.
Crude Oil Prices – Short-term Fibonacci Targets
Thanks for reading and remember to always trade with discipline… and always use a stop!
Twitter: @TheFibDoctor
No position in any of the mentioned securities at the time of publication. Any opinions expressed herein are solely those of the author, and do not in any way represent the views or opinions of any other person or entity.


