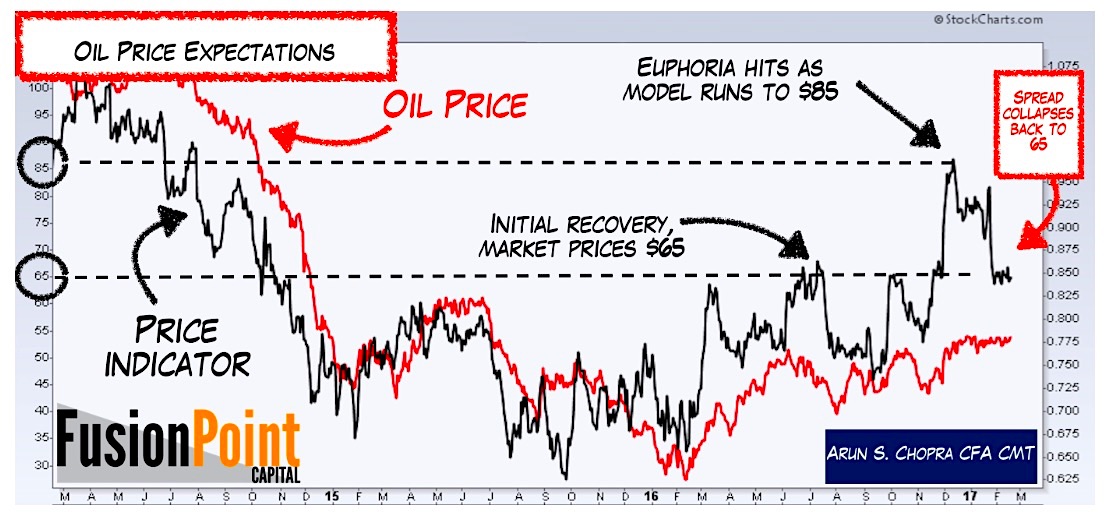
Below, Arun shows just how far bullish sentiment got at the peak of this rally, which could ultimately have important ramifications with respect to today’s crude compression scenario. In the first chart, Fusion Point’s proprietary oil price indicator spiked numerous times on ebullient expectations in late 2016. He notes the shifting market expectations from the initial recovery ($65 in summer of 2016), to the euphoria stage ($85 in early December 2016), having since fallen to $65 or so.
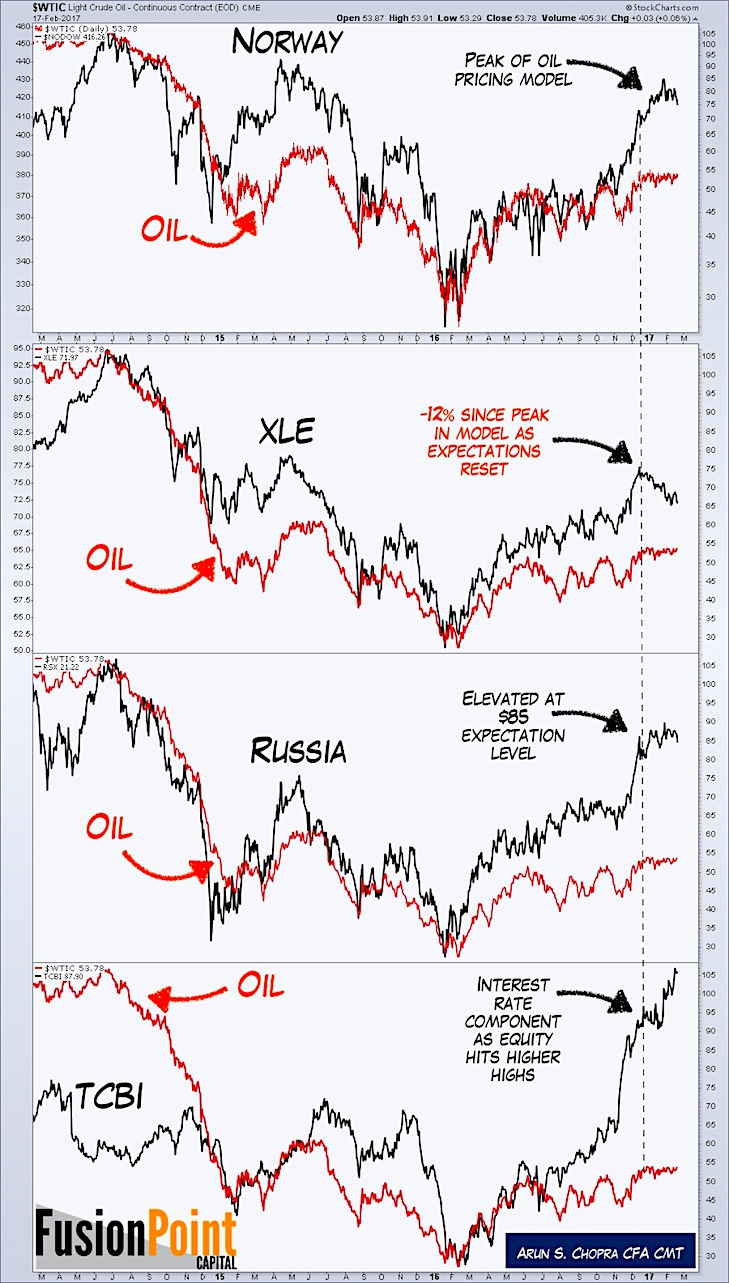
Another chart from Arun below shows how key oil related equity markets and stocks are still relatively extended even after the moderation in overall oil pricing expectations (i.e., the pullback in the oil pricing model). In the chart are oil heavy Norway, Russia, the U.S. Energy sector spider (XLE) and oil-dependent Texas Capital Bankshares (TCBI) versus west Texas crude.
Great insight as always from Arun. So what does all the above really mean? Are markets leading or lagging, is oil breaking higher or lower? To clear out a lot of the noise, you can watch the U.S. dollar.

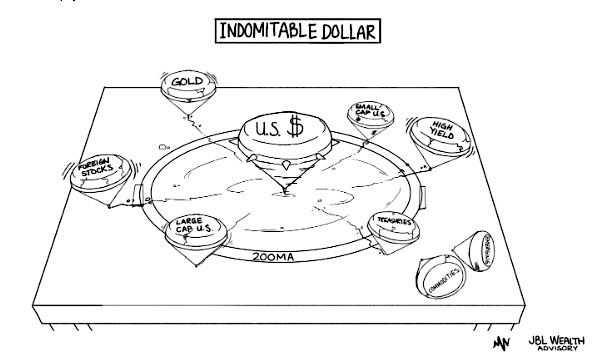
As far as resolution to the crude compression goes, the simplest solution may be to watch levels on the Indomitable Dollar in conjuction with the crude range. The rapid rise in the U.S. dollar was the main catalyst for the crude oil breakdown in 2014 and no one on the TV talked about it (it was all supply talk). Just over a year ago, the U.S. dollar was in full spinning top wrecking mode, having felled commodities (including oil) and spinning every major asset class below their 200-day moving averages. The greenback now sits at decade plus highs and like oil has been consolidating (oil in the low 50s, the dollar above 100). The lower and upper bounds on oil are $52 and $56, respectively. In terms of the dollar index (DXY), watch for a break and hold above 102 on the upside for a crude breakdown (on inverse correlation). And if the dollar index breaks below 100 again, and especially holds below 99, crude could be headed skyward out of the compression. It’s been all quiet on the dollar front as it has been on crude. It won’t last on either.
Thanks for reading.
Jason B. Leach – @JBL73
Chart by Arun Chopra – @FusionPointCapital
The authors may have positions in mentioned securities by the time of publication. Any opinions expressed herein are solely those of the author, and do not in any way represent the views or opinions of any other person or entity.


