Crude Oil prices are taking it on the chin in October… following stocks to the downside.
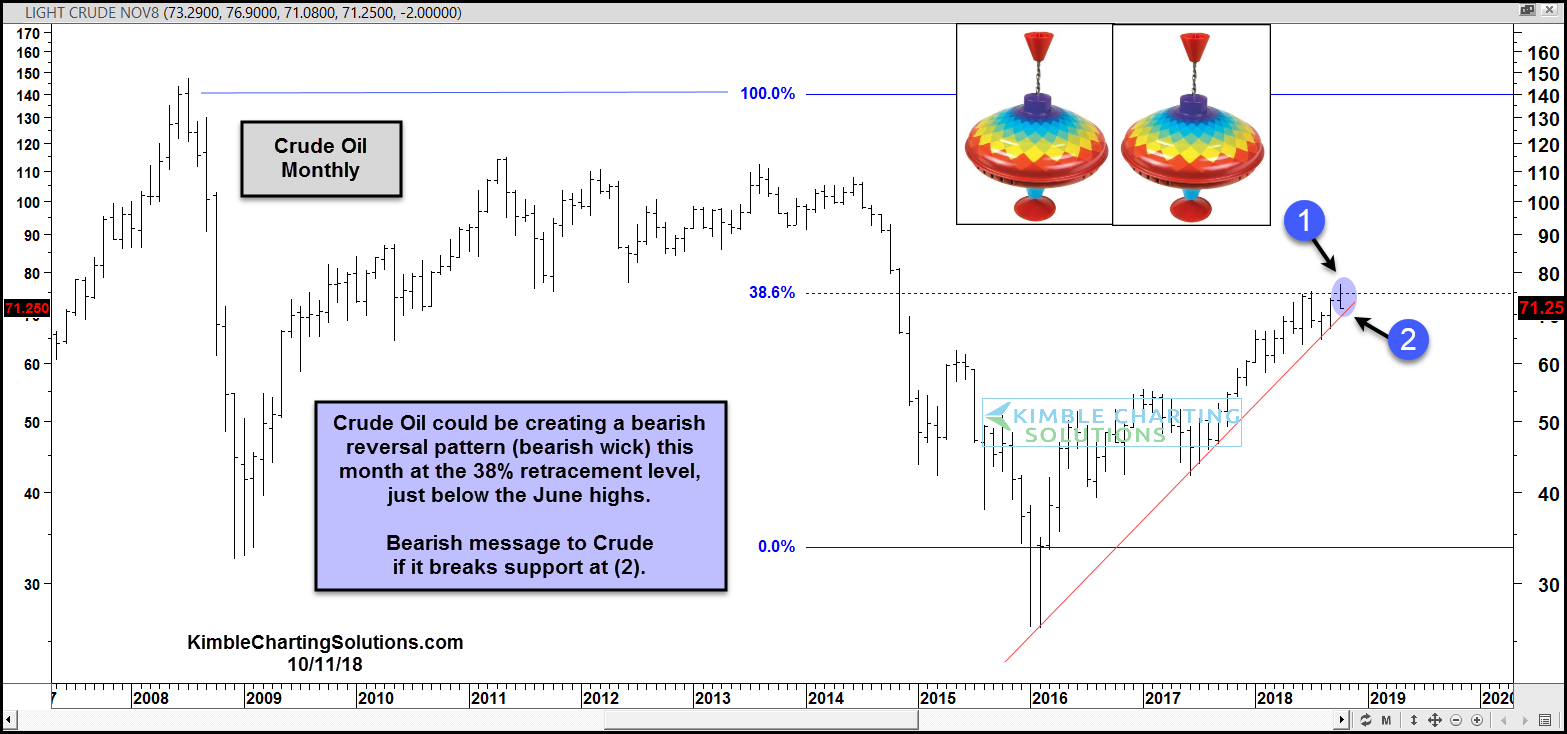
Depending on how Oil prices close the month, this could create a bearish monthly reversal and intermediate-term crude oil top.
The current high for the month is in/around the June highs which would make this a double top should crude oil prices head lower – see point (1) in the chart below.
The potential double top and bearish reversal is also occurring at its 38% Fibonacci retracement level – also at point (1).
Note that this bearish pattern has not been confirmed yet.
So what should investors be watching?
A bearish price message would occur if uptrend support breaks at point (2). Stay tuned this month!
Crude Oil Chart
Note that KimbleCharting is offering a 30 day Free trial to See It Market readers. Just send me an email to services@kimblechartingsolutions.com for details to get set up.
Twitter: @KimbleCharting
Any opinions expressed herein are solely those of the author, and do not in any way represent the views or opinions of any other person or entity.


