The sharp rally in crude oil prices over the last month has given the market a bit more confidence. But what oil does from here will bear importance.
Let’s take another look at the charts to see what fibonacci levels I’m watching now. Specifically on crude oil futures charts.
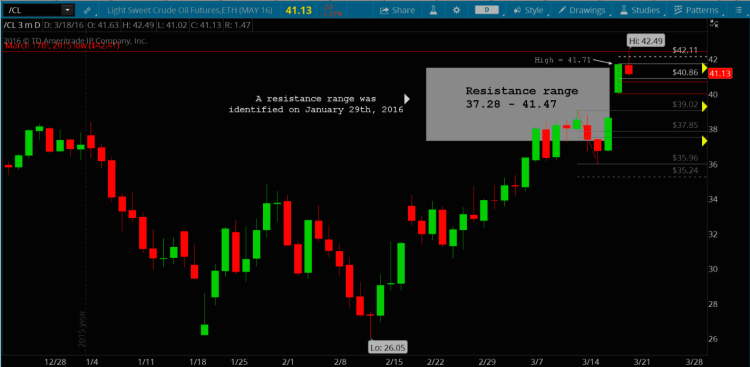
Crude Oil Futures are currently testing a price resistance zone that I first identified in January 2016 in this post.
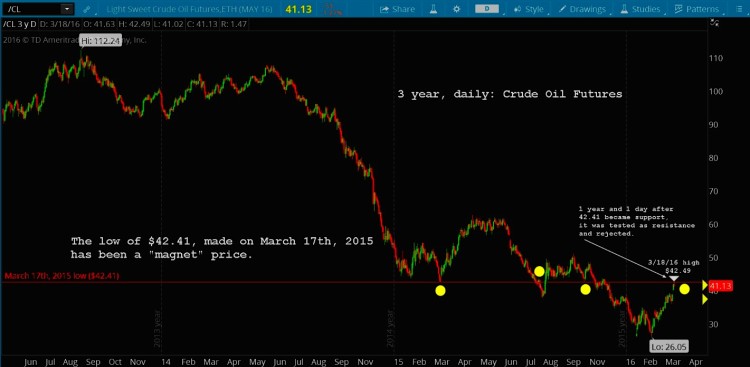
Just a bit higher resides another resistance zone at $42.41. This level has been a magnet for crude oil prices since March 2015. In the chart below, you’ll see how price has gravitated to that area many times. So put it on your radar.
Crude Oil Futures – 3 Year, Daily Chart
Now let’s drill down to a 3 month time frame. You can clearly see where price did, in fact, push into the price resistance zone and was able to close above it for one day. On Friday, March 18th, price once again hit the $42.41 level and was quickly rejected just above at $42.49.
Crude Oil Futures – 3 Month, Daily Chart
At this time, I would not be in a rush to get long or short crude oil futures, but rather be an observer for continued rejection or a solid break above the resistance zone and the $42.41 level.
Thanks for reading and always use a stop!
Twitter: @TheFibDoctor
No position in any of the mentioned securities at the time of publication. Any opinions expressed herein are solely those of the author, and do not in any way represent the views or opinions of any other person or entity.


