When we posted this warning to crude oil bulls a month ago, the United States Oil Fund (NYSEARCA: USO) had tested and retreated from the resistance area we had shown at 16.05.
Because the upward pattern appeared complete, we wrote that ” there is a strong probability that oil prices (and the $USO) will start a sizable correction soon.”
Soon after that post, crude oil and $USO saw a truly impressive meltdown.
The five-wave count up from 2017 actually appeared finished in July, which led us to treat the new high in October as a “b” wave in the expected correction. That made the near-term prospects even more bearish. We foreshadowed the crude oil meltdown when we wrote:
“…the more recent higher high can be seen as a type of overshoot correction that should end badly for bulls.”
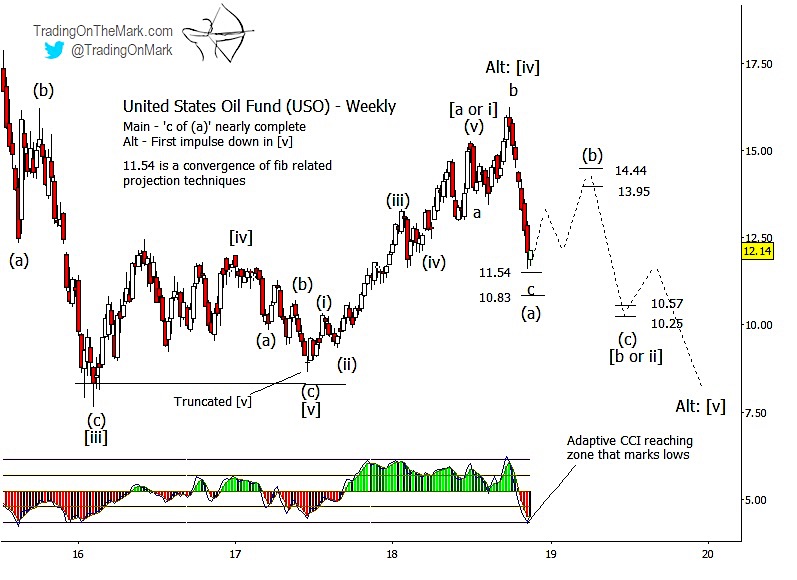
USO is now approaching some important Fibonacci-based supports at 11.54 and 10.83, so readers who took bearish positions should be looking for ways to lock in profits and start planning for the trades ahead.
It’s possible that the correction is entirely complete. Certainly the strong decline of recent weeks behaved as a C-wave should. However we favor a scenario where the a-b-c move shown on the chart represents just the first part of a larger (a)-(b)-(c) correction.
On a similar chart of crude oil futures (not shown here) the idea of a larger correction allows for waves (a) and (b) to coincide with inflections of the 42-week cycle. The first inflection ideally happens during the next few weeks, and the next one happens in May 2019.
Traders might begin shopping for opportunities at long positions based on nearby support, but they should realize that the next upward phase may be somewhat choppy as would be expected of wave (b) in the pattern.
Resistance at 13.95 and 14.44 comes from earlier Fibonacci-based supports, and that area might put a cap on wave (b).
An approximate target for wave (c) next year would be near the supports at 10.57 or 10.26, which were calculated using a variety of methods. We will be able to refine the target after USO climbs partway out of the hole it fell into recently.
With markets becoming so volatile this year, there are fantastic trading opportunities on all time frames, from monthly down to intraday. Become a subscriber at Trading On The Mark and get a trading edge with twice-daily chart updates for the S&P 500, treasury bonds, gold, crude oil, the Euro and the Dollar Index.
Twitter: @TradingOnMark
The authors may have a position in the mentioned securities at the time of publication. Any opinions expressed herein are solely those of the author, and do not in any way represent the views or opinions of any other person or entity.


