The price of crude oil is moving higher as supply side concerns grow. And this is pushing gas prices higher at the pump as well.
So what do we make of this? Crude oil is looking to break into new highs but may see a correction take place before another rally.
Today we will use Elliott wave analysis to show the potential trading outcomes.
Crude oil is approaching multiyear highs around 76-77 dollars and it looks like supply concerns are driving elevated prices; US inventories are at the lowest level since October 2018.
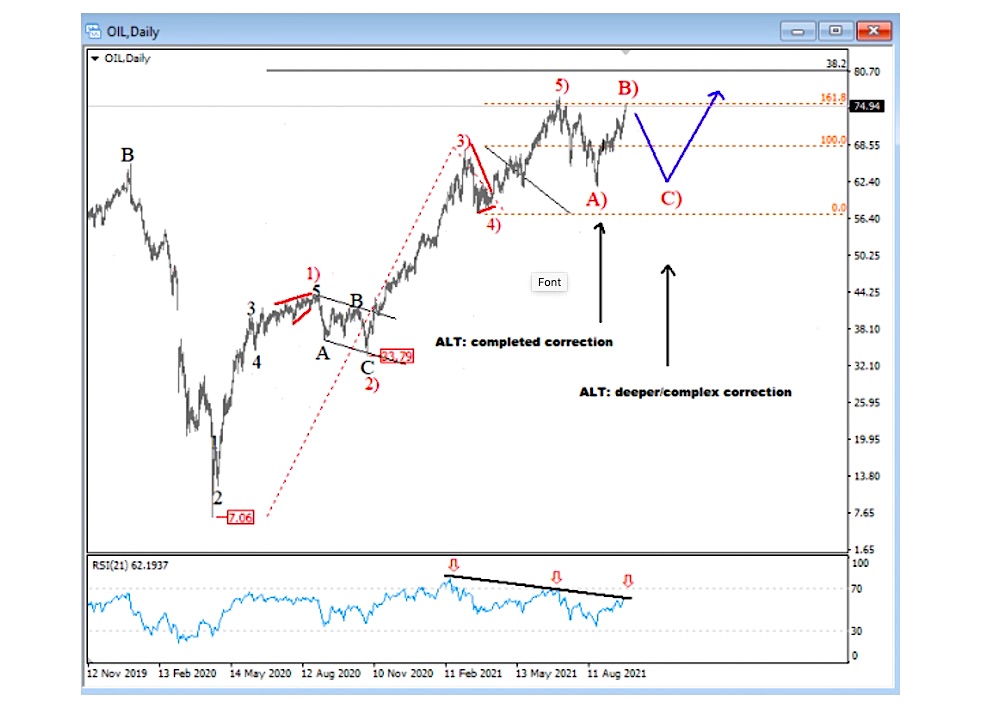
On the daily chart for crude oil, we can see that oil prices may still be trading in a deeper A-B-C correction after a completed five-wave cycle. Ideally, this structure would be more of a “flat”, which can still retest the 55-60 dollar support zone. However, should crude oil make a decisive break to new highs, then a correction has probably already been completed at the previous swing low in August.
Crude OIL Daily Elliott Wave Analysis Chart

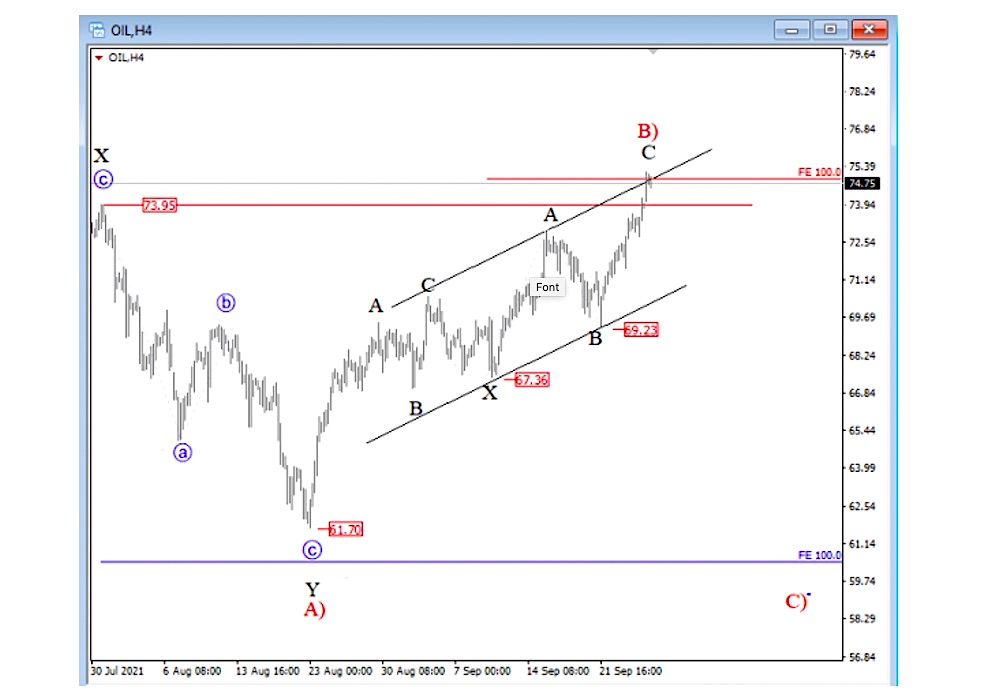
Applying Elliott Wave analysis to the 4-hour price chart, we can see that crude oil has rallied nicely but is trading at potential resistance around the 75 level. This may be part of a complex 7-swing corrective rally in wave B, so if price suddenly drops back below 69, then we will expect another decline back to lows for wave C.
Crude OIL 4-hour Elliott Wave Analysis Chart

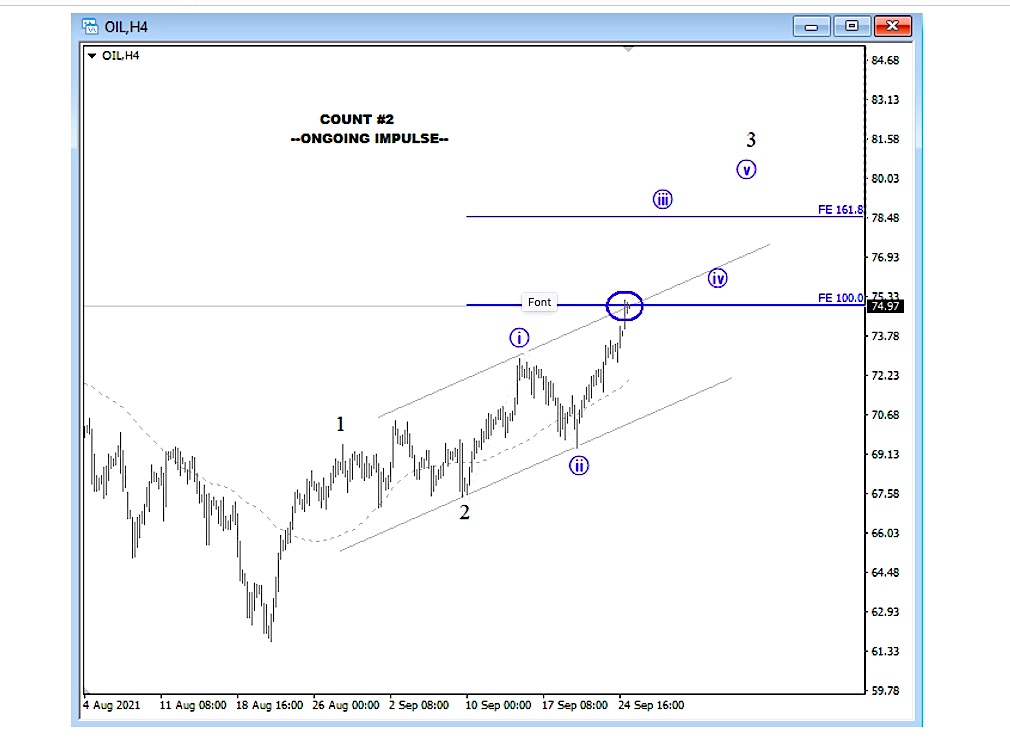
Lastly, should Crude oil remain in a strong up-trend towards the 79-80 area, then bulls are still in control according to COUNT #2, ideally within a new five-wave bullish impulse.
Crude OIL 4-hour Elliott Wave Analysis #2

Twitter: @GregaHorvatFX
The authors may have a position in the mentioned securities at the time of publication. Any opinions expressed herein are solely those of the author, and do not in any way represent the views or opinions of any other person or entity.


