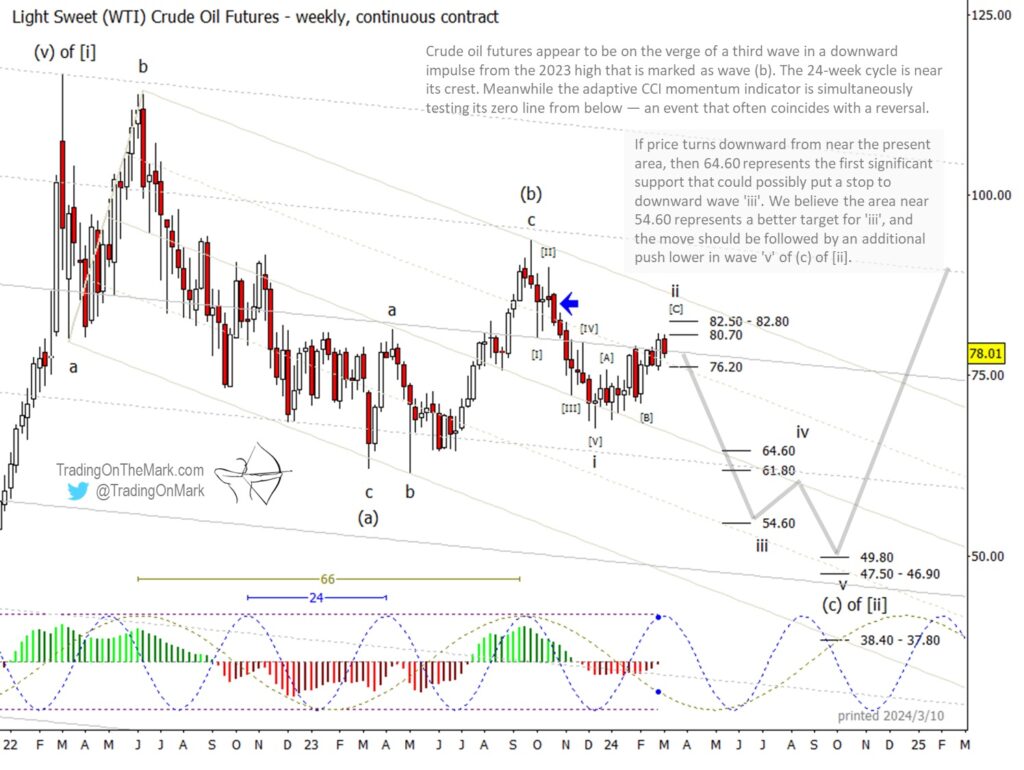
Here we follow up on our late October post about crude oil futures. Price followed our preferred bullish path, and we now have more information with which to forecast future moves. We now believe another downward swing should begin and are looking at a crude oil Elliott wave bearish forecast.
In our October post, we indicated that we thought price should fall from where the blue arrow is shown on the chart below. We also suggested that a break beneath the gray channel line (at a price of approximately $80) would serve as better confirmation of the downward move. Note that the gray line was later tested again from below, which represented another good short entry.
Now we believe there is enough structure on the chart to clarify how far the downward sequence has progressed. The move down from the 2023 high appeared impulsive, so we are counting it as wave ‘i’ of (c) of [ii]. The rise out of wave ‘i’ appears corrective as a wave ‘ii’ should, and it is now testing resistance zone at 80.70.
Even with our crude oil Elliott wave bearish forecast, we cannot rule out a test of higher resistance near 82.50 – 82.80. Any indicator-based signals for a downward turn will be more apparent on charts that are faster than the weekly chart shown here.
Better confirmation of the downward turn would come with a daily and weekly close beneath 76.20, at which point the trend following crowd might get onboard with the trade.

Some technical factors favoring a downward turn from nearby include the 24-week cycle being near its crest and the adaptive CCI momentum indicator showing a test of it’s zero line from below.
If price turns downward in sub-wave ‘iii’, the first area to watch for possible support would be near 64.60. However we believe price can push considerably lower than that, and the area near 54.60 looks like a better support target for ‘iii’. After that, we would expect a fourth-wave consolidation to appear before price again tries to push downward to complete the impulsive wave (c) of [ii].
Within our crude oil Elliott wave bearish forecast, lower targets near 49.80, 47.50 and 46.90 look viable before price finds durable support for a new upward phase.
Trading On The Mark uses technical analysis to identify the trends and turns in intraday, daily and weekly markets for commodities, energy, currency, bonds and indices. Visit our website for more charts, and follow us on X for updates and special offers.
Twitter: @TradingOnMark
The authors may have a position in the mentioned securities at the time of publication. Any opinions expressed herein are solely those of the author, and do not in any way represent the views or opinions of any other person or entity.


