Crude oil futures prices dipped below $27 per barrel last week before recovering with a late week rally that recaptured the psychological level of $30.
That rally may seem minor in the scheme of things, but it has traders of all asset classes feeling better.
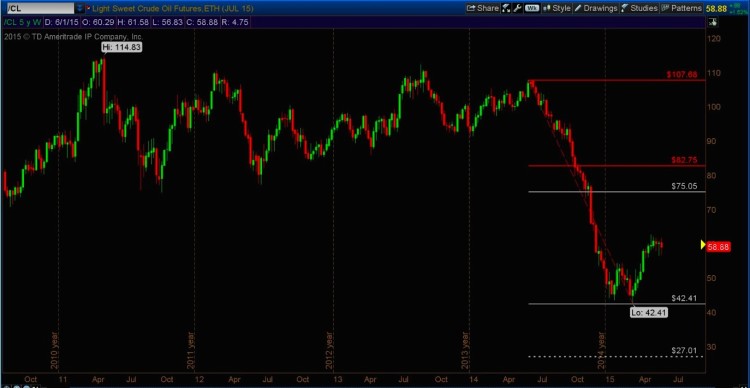
The crude oil decline has been sharp, but its been a long time in the making. In June of 2015 I wrote a piece on Crude Oil futures and gave a price target of $27.01. At the time, crude was trading at $58.88, so a crude oil decline of 54.12% seemed like stretch at best.
It took some time, but the oil market made its way to my mark. I derived this price target using my Fibonacci method that I like to call “One shot, one kill.” Below is the original chart that I shared prior to the recent crude oil decline to new lows.
Crude Oil Futures – 5 Year, Weekly Chart (from June 2015)
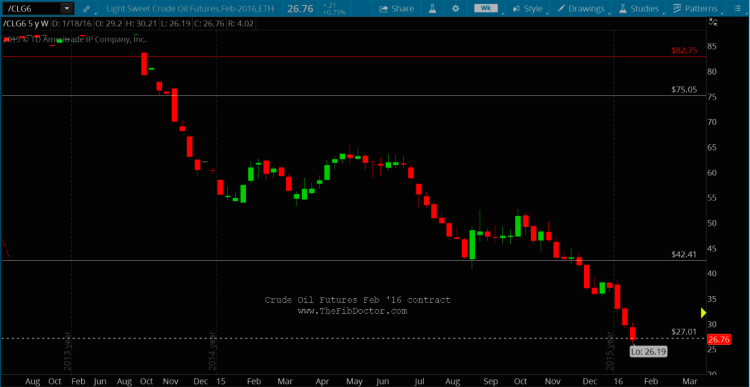
Fast forward to the week of January 18th, 2016 and the price target of $27.01 was indeed hit on the February ’16 (G6) futures contract. Crude oil is currently trading around $32 on hints the ECB is poised to ease monetary policy even more. Is the market following crude oil prices or is crude following the market? Is the crude oil decline over? Stay tuned.
Below is the updated chart.
Crude Oil Futures – 5 Year, Weekly Chart
Thanks for reading and always use a stop.
Twitter: @TheFibDoctor
No position in any of the mentioned securities at the time of publication. Any opinions expressed herein are solely those of the author, and do not in any way represent the views or opinions of any other person or entity.


