Inflation concerns peaked last year when agriculture and oil prices peaked.
This year has seen inflation fears subside as key price inputs fall.
BUT investors should not be complacent. Inflation risks remain.
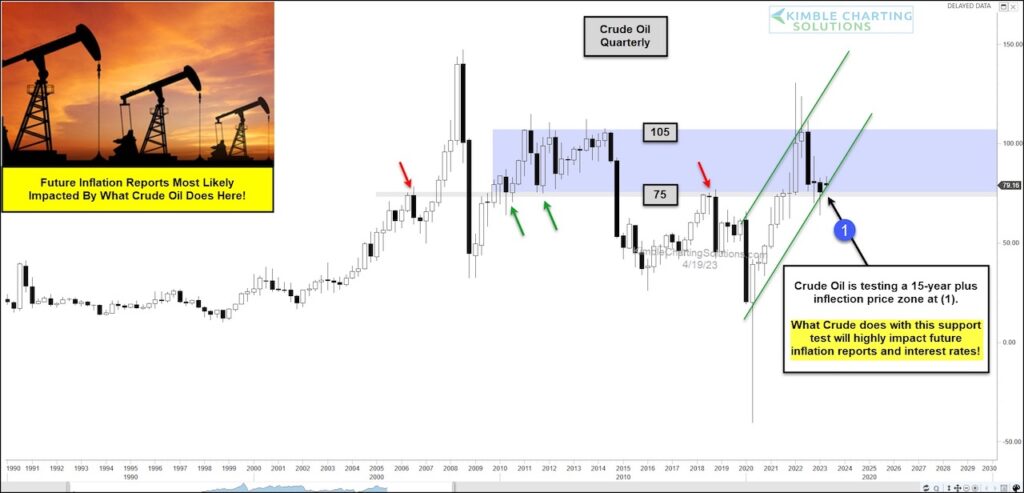
Today, we look at a “quarterly” chart of Crude Oil to underscore the “behind the scenes” inflation battle.
As you can see, Crude Oil tested a 15-year lateral resistance level (combined with channel resistance) and has been on the decline since.
But it is currently testing its up-trend price support level at (1). And, in my humble opinion, future inflation reports will most likely be impacted by what happens at (1).
If support continues to hold, inflation will likely remain stubbornly high. Stay tuned!!
Crude Oil “quarterly” Chart

Note that KimbleCharting is offering a 2 week Free trial to See It Market readers. Just send me an email to services@kimblechartingsolutions.com for details to get set up.
Twitter: @KimbleCharting
Any opinions expressed herein are solely those of the author, and do not in any way represent the views or opinions of any other person or entity.


