Its been an interesting year in the financial markets, to say the least.
And today’s chart qualifies as “interesting” indeed.
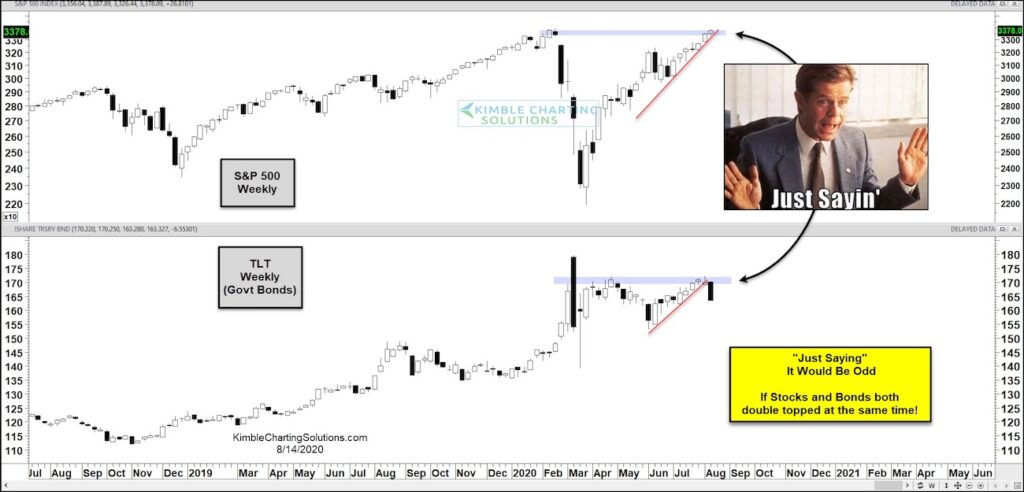
When the market crashed in March, bond prices surged as yields fell. And the 20+ Year US Treasury Bond ETF (TLT) hit $179 before reversing lower. This seemed like a somewhat normal market response.
The past 4 to 5 months have seen stocks rise, with the Nasdaq hitting all-time highs and the S&P 500 (SPY) re-testing its highs – see chart below.
But what’s interesting here is that bonds (TLT) re-rallied back up over $170 on two separate occasions. And bonds are reversing lower this month, raising an important question: Could stocks and bonds reach a double peak at the same time?
Keep an eye on the S&P 500 here… and stay tuned!
S&P 500 Index vs 20+ Year US Treasury Bond ETF Chart

Note that KimbleCharting is offering a 2 week Free trial to See It Market readers. Just send me an email to services@kimblechartingsolutions.com for details to get set up.
Twitter: @KimbleCharting
Any opinions expressed herein are solely those of the author, and do not in any way represent the views or opinions of any other person or entity.


