Inflation and interest rates seem to be hot topics in 2024.
So today we take a look at the 10 Year US Treasury Bond Yield (TNX) to see if it’s hinting at what’s next.
Spoiler alert: It’s kind of in no-man’s land. There’s an opportunity for lower rates but a broader consolidation may keep interest rates in a trading range.
Let’s check out a “weekly” chart to see what it’s telling us.
Note that the following MarketSurge charts are built with Investors Business Daily’s product suite.
I am an Investors Business Daily (IBD) partner and promote the use of their products. The entire platform offers a good mix of tools, education, and technical and fundamental data.
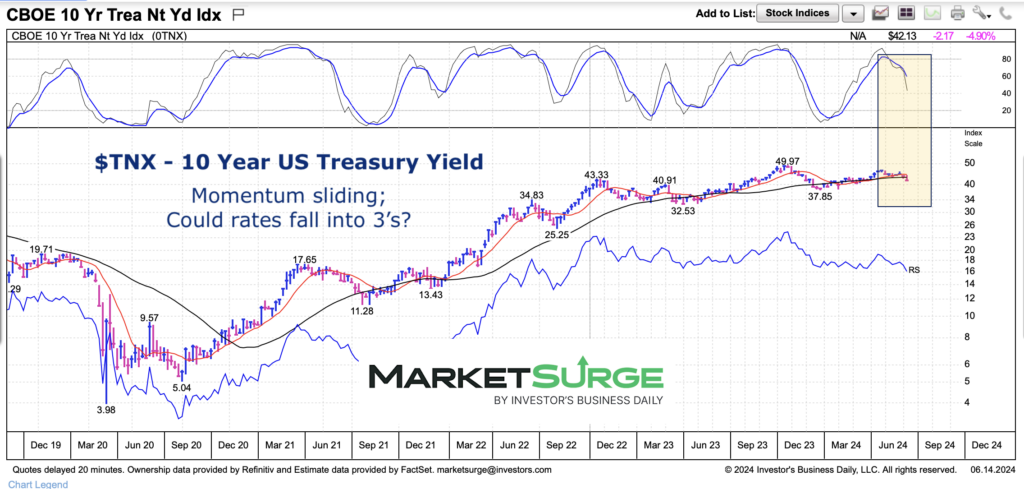
$TNX 10 Year US Treasury Bond Yield “weekly” Chart
Interest rates have been in a slightly elevating flat over the past 20 months. So much for the non-stop rate cut chatter. However, if rates are going to head lower, the window may be the coming weeks. Why? Momentum is falling. And the 10-year yield is below its major moving averages.
That said, each decline has found support and the overall macro conditions may keep rates within this elevated plateau.
Twitter: @andrewnyquist
The author may have a position in mentioned securities at the time of publication. Any opinions expressed herein are solely those of the author, and do not in any way represent the views or opinions of any other person or entity.

 and Semiconductors (SMH): Concerning Price Pattern?")


 and Semiconductors (SMH): Concerning Price Pattern?")

