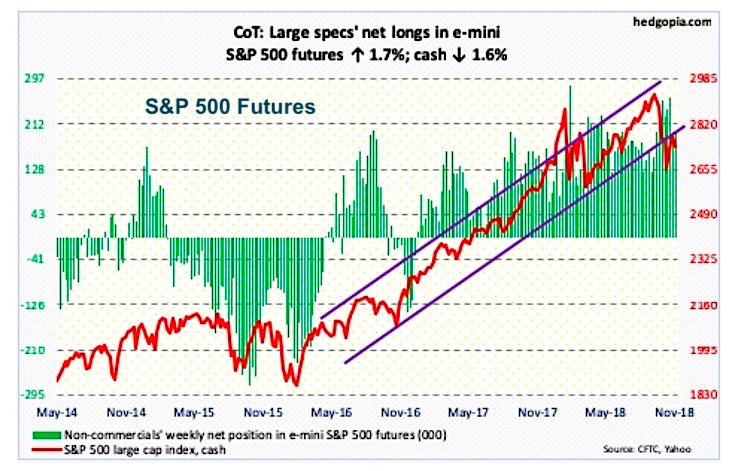
The chart below looks at non-commercial futures trading positions for the S&P 500 (NYSEARCA: SPY). For the week the S&P 500 closed lower by -1.6%.
Here’s a look at S&P 500 futures speculative positioning. Scroll further down for commentary and analysis.
Note that the chart and data that follow highlight non-commercial commodity futures trading positions as of November 13, 2018. This data was released with the November 16, 2018 COT Report (Commitment of Traders).
Note that this chart also appeared on my blog.
The S&P 500 (SPY) declined sharply during the front half of the week, only to rally back and recover some of the losses by week’s end. Can bulls stop the selling and carve out a bottom?
Let’s look at the COT data and technicals to see what’s next…
E-mini S&P 500: Currently net long 201.4k, up 3.4k.
After watching the S&P 500 Index fall for 5 straight trading sessions, bulls put their foot down on Thursday and rallied the mark back from the depths to down -1.6% for the week.
Fund flows have been tentative at best. In the week ending Wednesday, the SPDR S&P 500 ETF (SPY) gained $184 million (ETF.com). In the same week, US-based stock funds (including ETF’s) brought in $2.7 billion (Lipper.com). Since the S&P 500 began its waterfall decline (week ending Oct 3rd), these funds have lost $17.8 billion.
It’s worth noting that Thursday’s reversal higher on the S&P 500 Index comes at an important point in time & price. Should it hold, this would mean a higher low has been made versus the prior low of October 29. Overhead, stocks will do battle with the 200-day moving average at 2760.69. This MA (along with the 50) is falling. After the 200-day MA comes major resistance at 2800.
Twitter: @hedgopia
Author may hold a position in mentioned securities at the time of publication. Any opinions expressed herein are solely those of the author, and do not in any way represent the views or opinions of any other person or entity.


