The following chart and data highlight non-commercial commodity futures trading positions as of May 29, 2018.
This data was released with the June 1 COT Report (Commitment of Traders). Note that this chart also appeared on my blog.
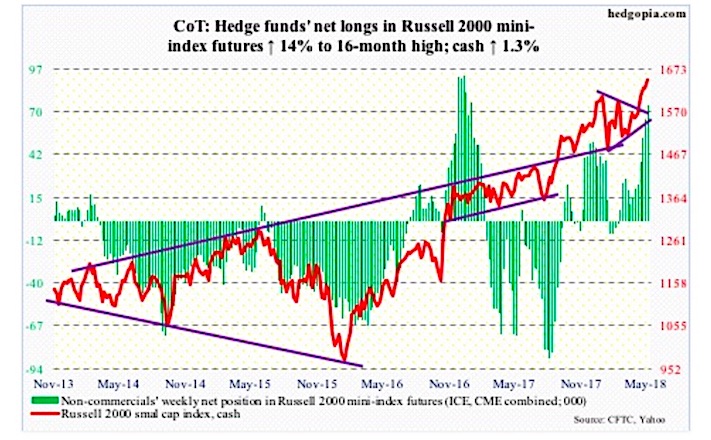
The chart below looks at non-commercial futures trading positions for the Russell 2000. For the week, the Russell 2000 (cash) climbed higher by +1.3%.
Here’s a look at Russell 2000 futures speculative positioning. Scroll further down for commentary and analysis.
Russell 2000 Futures: Currently net long 74.2k, up 9.1k.
Of major US equity indices, the Russell 2000 Index is the only one to have rallied to a new high after the late-January/early-February decline. From risk-taking perspective, this can be taken as bullish. But at the same time high-yield corporate bonds are severely lagging; risk appetite for these bonds has been on the wane for a while.
Amidst this, the breakout of two weeks ago on the cash (1647.98) was once again defended this week. Non-commercials further added to net longs, although ETF flows were a little shaky.
In the week ended Wednesday, $49 million came out of IWM (iShares Russell 2000 ETF), while IJR (iShares core S&P small-cap ETF) gained $198 million (courtesy of ETF.com).
Twitter: @hedgopia
Author may hold a position in mentioned securities at the time of publication. Any opinions expressed herein are solely those of the author, and do not in any way represent the views or opinions of any other person or entity.


