Euro: The Markit PMI for the Eurozone rose to 53.7 in March from 53 in February. However, businesses only reported a slight increase in new orders and hiring.
On March 10th, the ECB cut growth forecast for 2015 from 1.7 percent to 1.4 percent. It also announced a whole host of stimulus measures, including further reductions in key interest rates, additional purchases of government bonds and a new purchase program of corporate bonds, as well as a new program of cheap, medium-term loans.
Too soon to say if any of this would have meaningful impact on the economy. If past is guide, it will be prudent to fade the optimism.
The euro did exactly that – 1.6 percent higher than just prior to the March 10th decision.
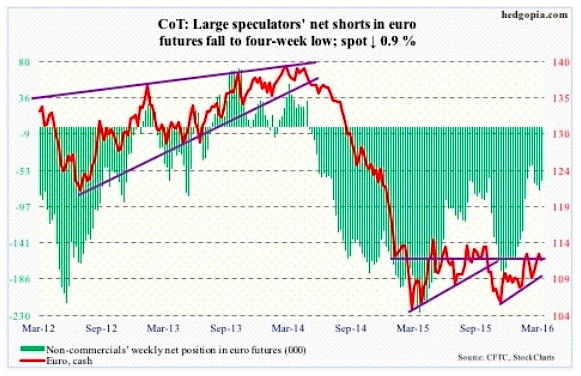
That said, after giving out signs last week that it was headed lower near-term, the euro likely is not done going down. The 200-day moving average lies at 110.48, and likely gets tested.
COT Futures: Currently net short 66.1k, down 11.5k.
COMMODITIES
Crude Oil: So a deal among some OPEC members and Russia to freeze production is meaningless as Saudi Arabia is the only country with the ability to increase output, according to a senior IEA official.
Mid-February, Saudi Arabia and fellow OPEC members Qatar and Venezuela agreed with Russia (non-OPEC) to freeze output at January levels. Libya and Iran are not going along. Not sure how much the IEA comment contributed to crude oil’s decline this week.
Technicals definitely did.
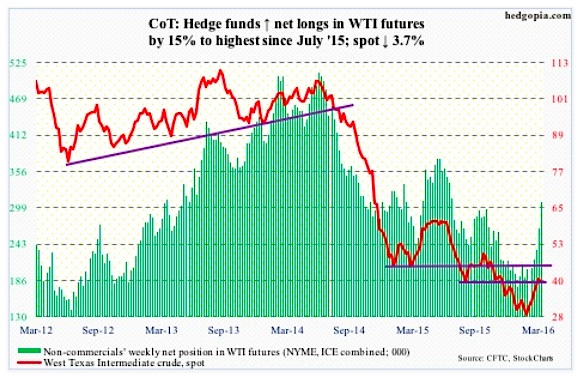
Last Friday, spot West Texas Intermediate crude produced what looked like a shooting star near its 200-day moving average. Right above lied another layer of resistance at 43.50 going back to January 2015. Off the February 11th low, oil rallied 63 percent, so fatigue was setting in.
Plus, U.S. crude supply continued to rise. Yet another record. In the week ended March 18th, stocks rose another 9.4 million barrels to 532.5 million barrels. In the past 11 weeks, inventory has gone up by 50.2 million barrels!
Crude imports rose, too, by 691,000 barrels/day to 8.4 million b/d. This was the highest since June 2013.
Markets had been ignoring the parabolic rise in inventory, instead focusing on gasoline stocks, which dropped by another 4.6 million barrels to 245 million barrels. Stocks are now down by 13.6 million barrels in the past five weeks.
Similarly, crude production fell by 30,000 b/d to nine mb/d. Production reached a record 9.61 mb/d in the June 5th (2015) week.
Distillates, however, rose, by 917,000 barrels to 162.3 million barrels. And refinery utilization fell by six-tenth of a percent to 88.4 percent.
On March 16th, spot WTI broke out of resistance at 38 and change. That support was tested on Thursday – successfully. Daily overbought conditions have unwinding left still. Odds favor crude continues to come under pressure next week. There is good support at just below 35.
Non-commercials continue to add net longs – now at 21-week high.
COT Futures: Currently net long 308.7k, up 41.3k.
Gold: Spot gold finally caved.
As had been continuously pointed out on this blog, with the metal having essentially gone sideways since February 11th even as GLD, the SPDR gold ETF, was attracting loads of money and non-commercials were adding to net longs, risks were rising that they would run out of patience.
In the week ended Wednesday, GLD lost $375 million, on the heels of $4.1 billion in outflows in the prior week (courtesy of ETF.com).
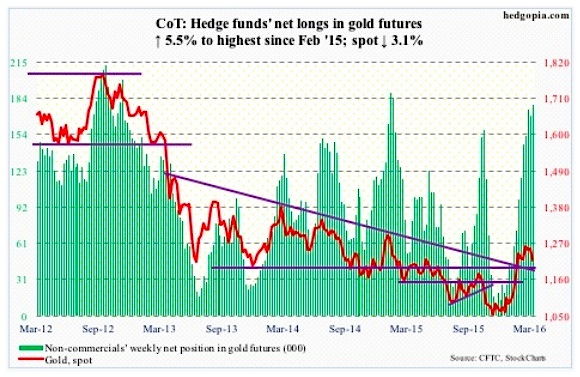
Similarly, for the first time in eight weeks, non-commercials last week cut net longs. This week, they added, up 5.5 percent. That said, holdings are as of Tuesday, and the spot lost 2.6 percent since. Makes it harder to hang on to these longs.
On a weekly chart, spot gold has plenty of room to continue unwinding its overbought conditions. With a 10/20 daily crossover, the immediate risk for the metal is breakout retest of 1180. The rising 50-day moving average lies at 1195. This price range is a must-hold.
COT Futures: Currently net long 178.8k, up 9.3k.
Thanks for reading.
Further Reading From Paban: “Are Market Valuation Metrics Unwinding From The Highs?“
Twitter: @hedgopia
Read more from Paban on his blog.
The author may hold positions in mentioned securities at the time of publication. Any opinions expressed herein are solely those of the author, and do not in any way represent the views or opinions of any other person or entity.


