The following is a recap of The COT Report (Commitment Of Traders) released by the CFTC (Commodity Futures Trading Commission) looking at futures positions of non-commercial holdings as of November 24, 2015. Note that due to the holiday, the CFTC released COT Report data on Monday (instead of Friday). Note as well that the change in the November 24 COT report data is week-over-week.
10-Year Treasury Note: Chances of the Federal Reserve moving next month on rates (FOMC meeting on December 15-16) have risen to 78 percent. That is what fed funds futures are predicting.
At the same time, the two-year yield, which tends to be the most sensitive to Fed policy, has risen to 0.94 percent – the highest since May 2010… was 0.57 percent as early as October 14th.
The fly in the ointment? The long end of the yield curve is not as enthusiastic as the short end about what is looking like an imminent hike in the middle of December. The yield curve is flattening.
The 10-year does not seem convinced of the prevailing argument that the Federal Reserve wants to raise rates because of strong macro data.
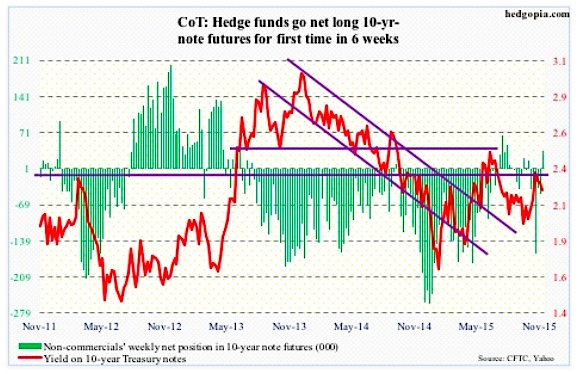
Per the recent COT report data, non-commercials went net long for the first time in six weeks.
Seen in this light, the Fed may be indifferent to November’s payroll numbers, due out this Friday, unless the data is extremely weak.
COT Report Data: Currently net long 35.1k, up 83.2k.
30-Year Treasury Bond: This week’s major economic releases are as follows.
October’s pending home sales index was published yesterday, coming in at 107.7, versus upwardly revised 107.5 in September. The index peaked at 112.3 in May this year – the highest since 112.5 in May 2006 – and correlates well with sales of existing homes. The latter dropped to a seasonally adjusted annual rate of 5.36 million units in October, down from 5.55 million in September; July saw a high of 5.58 million – the highest since 5.79 million in February 2007.
Today, we get the ISM manufacturing index for November. The October reading of 50.1 was barely in expansion territory – the lowest since 50 in May 2013. The orders component, however, rose from 50.1 in September to 52.9.
The ISM non-manufacturing index comes out on Thursday, and it is faring much better than manufacturing. In October, the main index rose from 56.9 to 59.1, and orders from 56.7 to 62.
On Wednesday, the Beige Book is released, as well as revised productivity numbers for the third quarter. Non-farm output per hour rose a mere 0.4 percent year-over-year in the quarter, and is struggling to gain traction.
The advance report on durable goods for October was released two weeks ago. Revised estimates, as well as non-durable goods data, will be published on Thursday. This series has been posting weak numbers for several months now, with preliminary estimates for October showing a slight uptick. Orders for non-defense capital goods ex-aircraft rose 0.4 percent year-over-year – the first increase in nine months.
Friday, we get November’s employment report. October was a surprise. Having added sub-200,000 non-farm jobs in August and September, the month produced 271,000. That said, momentum is in deceleration, with 2014 having averaged 206,000, versus 260,000 in 2014. As well, the average hourly earnings of private-sector employees grew 2.5 percent year-over-year – the first such increase since July 2009.
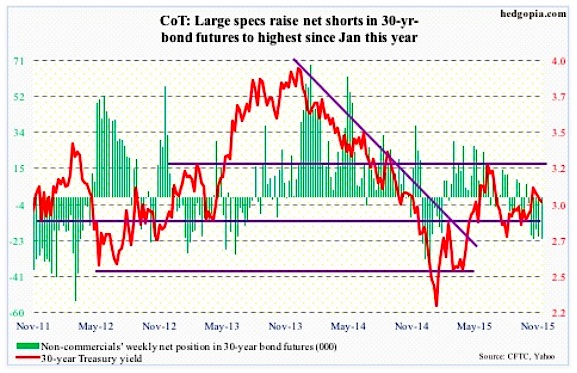
COT Report Data: Currently net short 21.9k, up 1.2k.
Crude Oil: The black gold began to move as soon as trading opened last Monday. Come Tuesday, Turkey downs a Russian jet. Oil was handed an additional tailwind.
Spot West Texas Intermediate crude oil rallied 0.8 percent in the week, more or less ignoring the EIA data that had more negatives than positives.
For the week ended November 20th, stocks rose across the board.
Crude oil stocks increased 961,000 barrels, to 488.2 million barrels. This was the ninth straight weekly increase, with stocks at the highest since the April 24th week… Gasoline stocks rose 2.5 million barrels, to 216.7 million barrels… Distillate stocks rose 1.05 million barrels, to 141.4 million barrels. The prior week was at a 19-week low.
Crude oil imports rose 365,000 barrels a day, to 7.3 mbpd, essentially offsetting the decline in the prior week.
In contrast, crude oil production fell by 17,000 barrels per day, to 9.17 million barrels per day. Oil production peaked at 9.61 mbpd in the June 5th week… Refinery utilization rose further – up 1.7 percentage points to 92 percent. It has now risen for six straight weeks, from 86 percent in the October 9th week. Utilization peaked at 96.1 percent in the August 7th week.
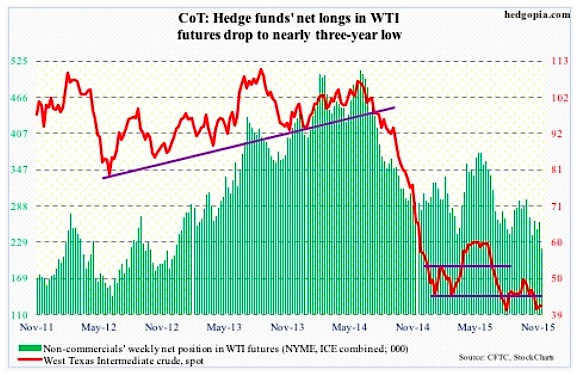
Per the COT report data, non-commercials have now reduced net longs in Crude Oil to the lowest since December 2012.
COT Report Data: Currently net long 218.7k, down 42.1k.
E-mini S&P 500: As of the 24th, with 489 of S&P 500 companies reporting, 3Q15 operating earnings estimates stood at $25.48; last year was $29.60.
With one month to go, at $106.68, earnings estimates for the year are still inching lower. At the end of the second quarter last year, 2015 estimates were $137.50. This year, S&P 500 operating earnings are on track to dropping 5.6 percent from last year’s $113.02. Question is, will it catch up with the stock market?
S&P points out that ex-energy, earnings would be up 6.1 percent this year. This is a nice statistic to look at, but does not help much – the same way it would not help if we excluded tech/telecom in 2000-2001 and financials in 2007-2008.
As important a sector as energy is, the decline in earnings matters, as repercussions are felt widely, ranging from company bankruptcies to reduction in capital expenditures to layoffs. This is more of a rearview mirror.
Looking through the windshield, 2016 earnings become a focal point. Expectations are lofty – $126.54. These earnings estimates have come down from $137.50 at the end of 2014, but if realized they would have grown nearly 19 percent over 2015… Which would be the fastest growth since 2010. Quite a feat for stocks, if realized. For this to happen, both oil and the dollar need to reverse, with the former rallying and the latter retreating.
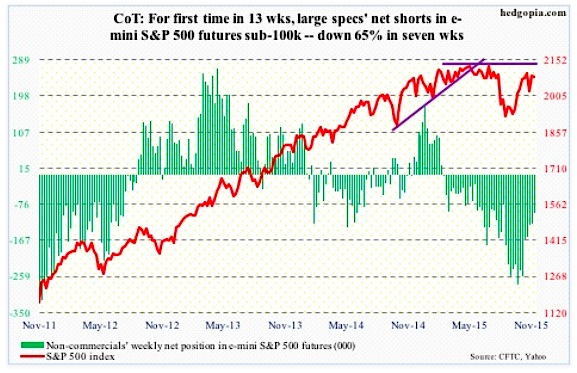
Non-commercials continue to cut back net shorts – now sub-100,000 contracts – and that has helped stocks.
COT Report Data: Currently net short 98.1k, down 27.7k.
continue reading on the next page…


