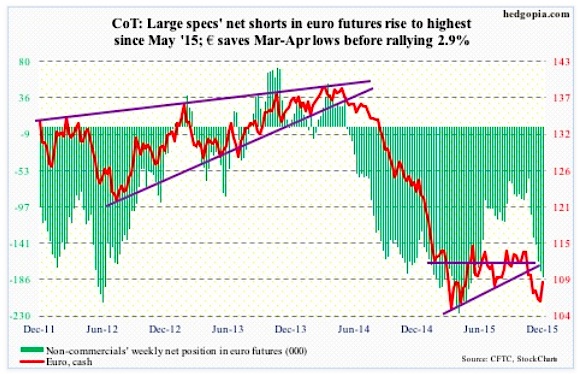
Euro: A classic ‘buy the rumor, sell the news’.
For the week, the euro rallied 2.9 percent. On Thursday alone, it jumped 3.1 percent – the largest increase since the 3.5-percent jump on March 18, 2009.
Mario Draghi, ECB president, had prepped the market for two months. Market expectations were very high. A lot was already priced in, with the euro down eight-plus percent since the middle of October.
In the end, what Mario Draghi offered was not enough – or was not perceived enough. Maybe Jens Weidmann, Bundesbank president, prevailed.
The deposit rate was only cut by 10 basis points to minus 0.3 percent. The existing €60-billion/month asset purchase program was only extended until the end of March 2017, not increased. On second thought, would anything satisfy the markets? Probably not.
As oversold as it was, the euro was itching to move higher. Ironically, a strong euro does not help the Eurozone inflation outlook.
There are tons of bearish bets on the euro. If they get unwound, the currency can surprise on the upside.
Per the COT Report, non-commercials added to net shorts in the euro… and probably got squeezed on Thursday.
COT Report Data: Currently net short 182.8k, up 7.4k.
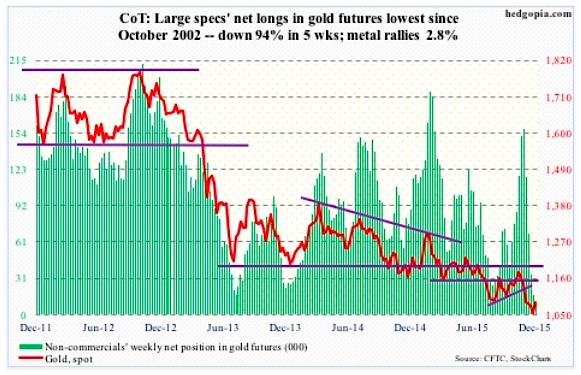
Gold: Until Thursday, spot gold prices were headed for another down week – its seventh. Then came Mario Draghi and the ECB decision, fueling a rally in the euro and a reversal in the dollar. The latter helped gold stage a rally.
If the trend continues in the currency land – euro up, dollar down – gold bugs, beat-up and bruised, can breathe a sigh of relief (duration notwithstanding).
On a daily chart for Gold, Thursday brought a bullish MACD crossover. Friday, reacting to the jobs report, the dollar rose, as did interest rates. Gold did not flinch. It went on to rally over two percent, past resistance at 1,070-1,080.
Prior to this, non-commercials had reduced net longs to the lowest since October 2002. A contrarian might find that bullish for gold – at least in the near-term.
COT Report Data: Currently net long 9.8k, down 6.6k.
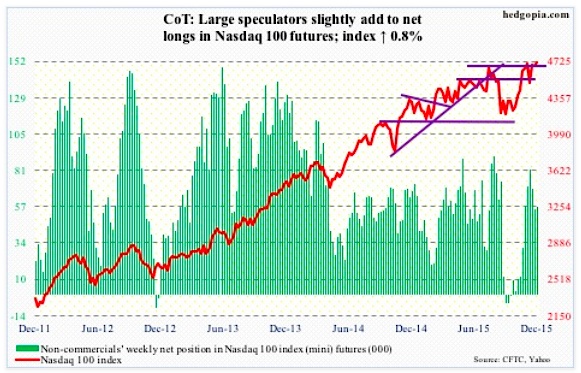
Nasdaq 100 Index (mini): Since April this year, the 4560 price point has acted lack a magnet, both repelling and attracting. This week, it acted as support, with the Thursday sell-off in technology stocks attracting buyers near that level.
Of the major U.S. stock market indices, the Nasdaq 100 acts the strongest. As well, it is comfortably above both its 50- and 200-day moving averages.
That said, non-commercials have used recent strength to slightly lighten up net longs, per recent COT report data.
COT Report Data: Currently net long 56.8k, up 1.5k.
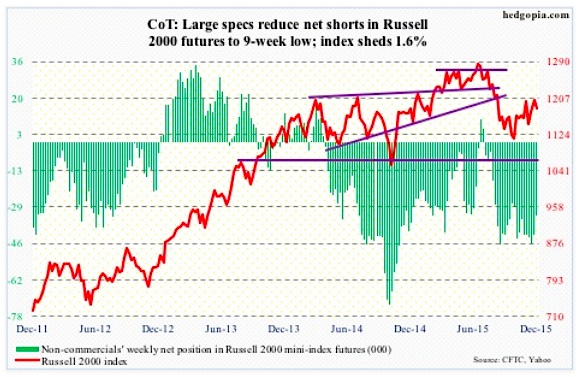
Russell 2000 mini-Index: Once again, the March 2014 horizontal resistance proved too tough to handle. In four of the past five weeks, the Russell 2000 bumped against the 1200 range, only to retreat.
This week, it made it to 1205, right underneath 1210-1215 resistance, and that was it for small cap stocks. This price range also approximated the 200-day moving average.
If there is any consolation, the 50-day moving average is still rising, though ever so slightly. Ditto with the iShares Russell 2000 ETF (IWM). The latter was rejected at its 200-day moving average on Monday through Wednesday.
Non-commercials have been right (thus far) not to buy into the small cap stocks story.
COT Report Data: Currently net short 33.1k, down 8.4k.
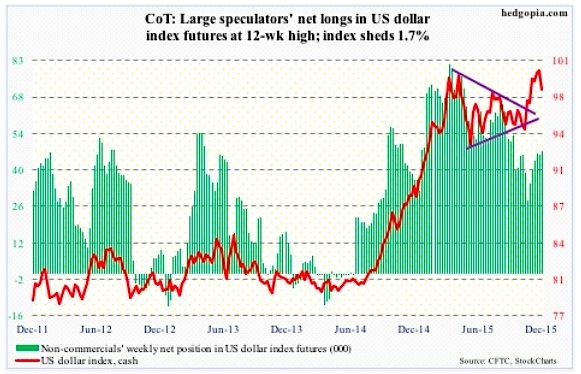
US Dollar Index: In the aforementioned speech, Ms. Yellen points out the role played by the US Dollar in dampening demand for U.S. exports. The US Dollar Index has appreciated measurably since the middle of last year.
Yet, she is also having to raise interest rates.
At least on Thursday this week, the US Dollar index did not follow U.S. interest rates higher, rather it reacted to the 3.1-percent jump in the euro by falling 2.4 percent. The intra-day high of 100.60 in that session was a hair’s breadth away from 100.71 in March this year. This nearly retraces 61.8 percent of the July 2001-April 2008 decline, and could prove to be an important inflection point.
On a weekly basis, the US Dollar index remains grossly overbought, and it just started unwinding those conditions.
Leading up to this, non-commercials never looked as enthusiastic as they were when the dollar index was trading at a similar level back in March/April.
COT Report Data: Currently net long 47.3k, up 1.2k.
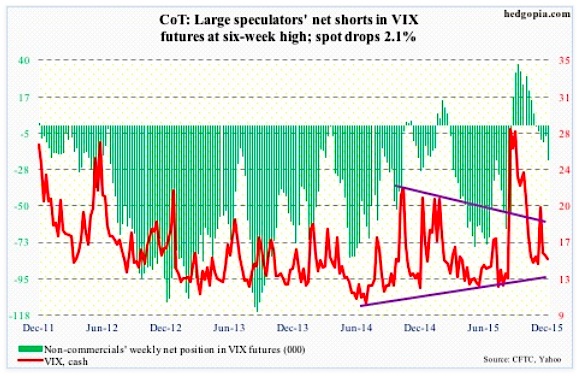
VIX Volatility Index: The spot Volatility Index (VIX) is searching for direction, with wild price action in the last two sessions. It gained 3.44 points on Thursday, and gave back 2.65 on Friday. Consequently, it has not moved too far away from its 200-day moving average.
COT Report Data: Currently net short 21.7k, up 14.8k.
Thanks for reading.
Twitter: @hedgopia
Read more from Paban on his blog.
The author does not have a position in any of the mentioned securities at the time of publication. Any opinions expressed herein are solely those of the author, and do not in any way represent the views or opinions of any other person or entity.

