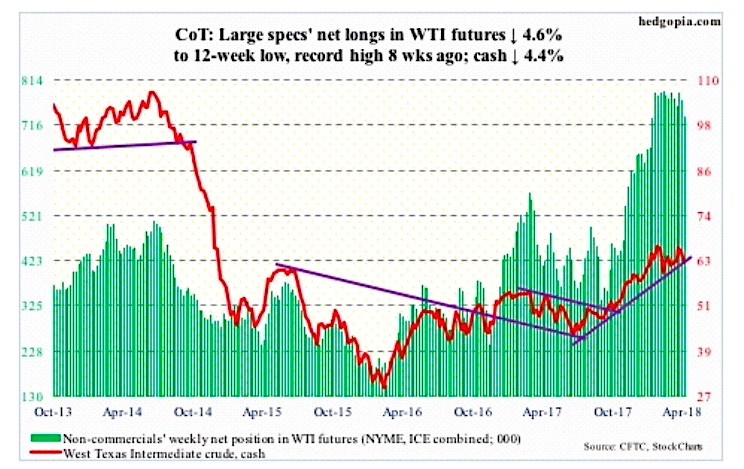
The following chart and data highlight non-commercial commodity futures trading positions as of April 3, 2017.
This data was released with the April 6 COT Report (Commitment of Traders). Note that these charts also appeared on my blog.
The chart below looks at non-commercial futures trading positions for crude oil. For the week, crude oil traded lower by -4.4%.
Crude Oil Futures
April 6 COT Report Spec positioning: Currently net long 734.5k, down 35.7k.
Nine sessions ago crude oil failed to make new highs, reversing lower off high marked on January 25. This was a bearish signal. This week, Spot West Texas Intermediate crude oil tested the 50-day moving average, and lost. Crude oil took a big hit on Friday when it lost 2.3 percent – now it is testing its uptrend line.
A failure here raises the likelihood that crude oil tests support at $60, which in all likelihood takes place next week. This support also approximates the daily lower Bollinger band.
Non-commercial traders are still heavily net long. A loss of $60 on the cash can lead them to continue to cut back. In this scenario, $55 is the next support, which is where the 200-day moving average rests.
The EIA report for the week of March 30 showed crude production continued its uptrend – up 27,000 barrels per day to 10.46 million b/d.
Distillate stocks rose too, by 537,000 barrels to 129.5 million barrels.
Crude oil and gasoline stocks, however, fell – down 4.6 million barrels and 1.1 million barrels to 425.3 million barrels and 238.5 million barrels, respectively.
As did crude oil imports, which dropped 250,000 b/d to 7.9 mb/d.
Refinery utilization inched up seven-tenths of a percentage point to 93 percent.
Twitter: @hedgopia
Author may hold a position in mentioned securities at the time of publication. Any opinions expressed herein are solely those of the author, and do not in any way represent the views or opinions of any other person or entity.


