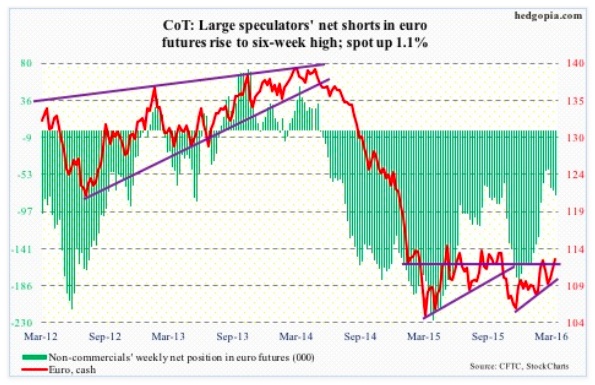
Euro: Eurozone inflation in February was revised up. In the year to February, the core rate rose 0.8 percent, versus the previous estimate of 0.7 percent. This is still below the ECB’s two-percent goal, nonetheless helped the euro rally 0.84 percent on Thursday. On Wednesday, it had already rallied one percent, thanks to the FOMC.
Mr. Draghi is probably not a happy man. After a 1.3-percent rally last week, the euro rallied another 1.1 percent this week. All that ‘shock and awe’ extra stimulus last week in vain!
The euro (112.71) is looking extended, though… rose to 113.38 on Thursday before reversing. Resistance at 114 goes back to January last year.
COT Futures Data: Currently net short 77.6k, up 5.6k.
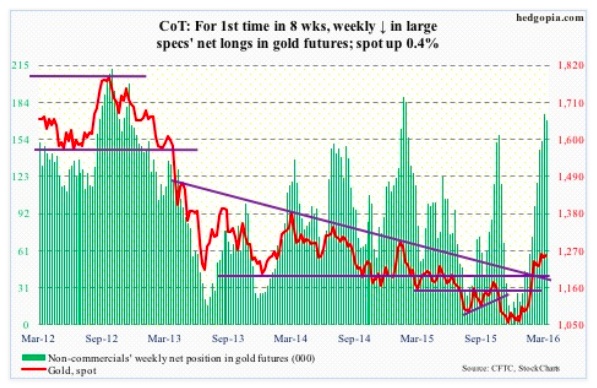
Gold: Gold bugs should be sending a big ‘thank you’ note to Ms. Yellen. Until Tuesday, spot gold prices looked ready to unwind the extreme overbought conditions it was in. A breakout retest of $1180 looked imminent.
Enter the FOMC decision. Gold prices rallied 2.5 percent on Wednesday, but failed to add to it on Thursday, although the dollar index continued lower.
With all three major central banks just having adopted gold-friendly policy and the metal having already reacted to it, the path of least resistance continues lower.
In the week ended Wednesday, the SPDR gold ETF (GLD) lost $4.1 billion (courtesy of ETF.com). Spot gold has essentially gone sideways for five weeks now. GLD longs are probably losing patience.
Similarly, in the one month ended March 8th, non-commercials raised net longs from under 100,000 contracts to nearly 175,000. Spot gold has not moved. For the first time in eight weeks, these traders cut net longs this week.
COT Futures Data: Currently net long 169.5k, down 5.3k.
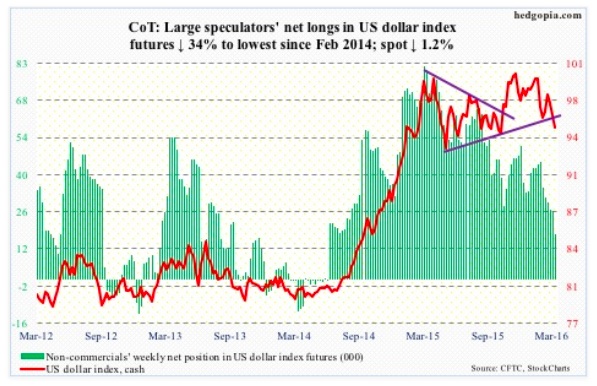
US Dollar Index: In the currency land, what the US Dollar index experienced on Wednesday and Thursday can be described as shellacking – down two percent.
Support at 97 is gone. In fact, on Wednesday – the FOMC decision day – the index tagged that resistance, which is where 200-DMA lies as well, and was vigorously denied.
Non-commercials continue not to show any love. They cut net longs of the US Dollar index to the lowest since February 2014.
That said, daily momentum indicators are grossly oversold.
COT Futures Data: Currently net long 17.5k, down 8.9k.
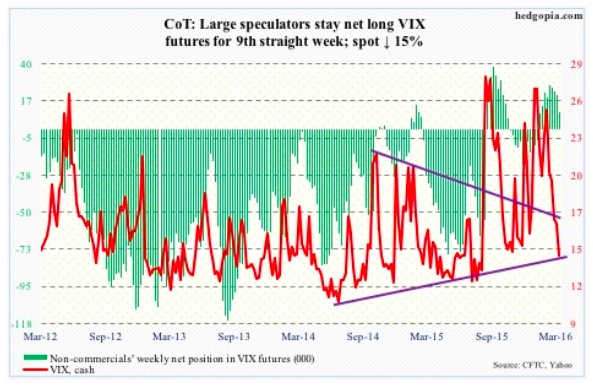
VIX: The August 2015 rising trend line, which otherwise was providing support, was broken on Wednesday, and spot VIX Volatility Index lost three points in a couple of sessions.
Ray of hope for volatility bulls: Friday produced a doji at the lower Bollinger Band.
As well, the VIX-to-VXV ratio closed the week at 0.78, matching the mid-March low last year. Also, this was the first time the ratio dropped into oversold zone in three months. Time to rally!
COT Futures Data: Currently net long 10.3k, down 10.8k.
Thanks for reading.
Twitter: @hedgopia
Read more from Paban on his blog.
Any opinions expressed herein are solely those of the author, and do not in any way represent the views or opinions of any other person or entity.


