The 2020 corporate earnings season, much like so many aspects of 2020, is like no other. Q1 results, released in April, were partially impacted by the pandemic but it was guidance that took the real hit. The majority of companies simply stopped providing forward guidance with the legitimate excuse being “nobody knows how this progresses”. Without guidance, analysts were left more to their own devices and imagined a rather dire Q2.
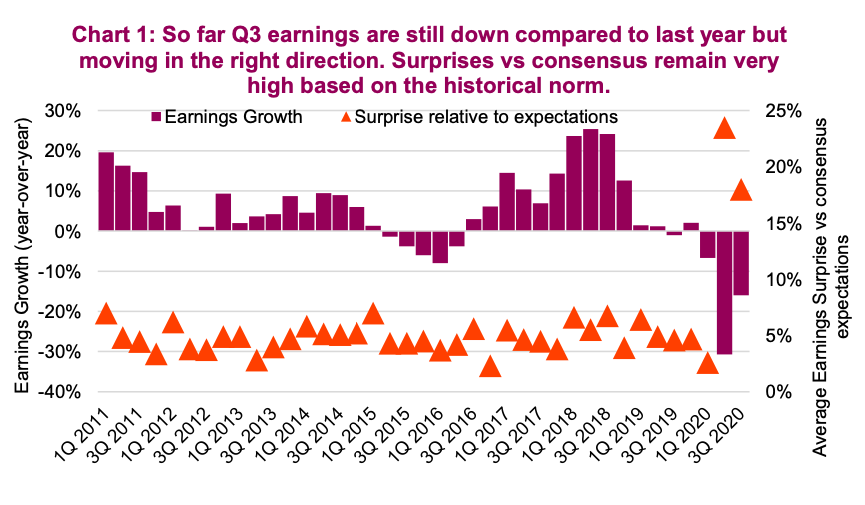
However, when Q2 results were released in July, it seems the analysts underestimated many companies’ ability to mitigate the hit to the bottom line. Corporate earnings were certainly down but not as far as expected. This led to the largest earnings surprises within our data history going back 20 years.
Q3 2020 Earnings Are Here… Positive Surprises Flow In
While many companies reinstated some forward guidance during Q3, it would seem analyst expectations are still too low. The positive surprise rate has remained elevated compared to historical norms, albeit not as high as Q2 (see chart 1 – orange triangles). While still early in the season, with about 30% of companies having reported, it is an impressive start. Earnings in aggregate are lower than 2019 by about 15% so far, but much better than Q2. If we are past the earnings trough, that is a positive.

Earnings provide a detailed glimpse into how a company is doing, so naturally results are an extremely important input into the value of a company and receive much scrutiny. When earnings are released, it is often a frantic period as there is a great deal of information that must be absorbed and reflected in the share price rather quickly. This often leads to significant share price moves in either direction. However, sometimes the market tends to overreact. If you believe a company is truly worth its future discounted cash flow, then a miss or beat of a nickel or a dime shouldn’t result in a material move, but often does. With that occasional price overreaction, we believe lies an opportunity.
Earnings overreaction strategy
Human behavior is often at the root of misspriced assets and this comes in many forms. Investors often overreact to near-term news or earnings, pushing a share price farther than warranted. The Earnings Overreaction strategy is a core strategy within the Purpose Behavioural Opportunities fund that we manage. The premise is simple, but counterintuitive. Availability bias causes investors to overweight the impact of the most readily available news. While earnings are important and the releases provide a necessary fundamental update from companies, investors will overreact to the releases causing the share price to swing wildly.
Building on previous research on members of the TSX 60 index that found a significant amount of mean reversion, we recently examined all members of the S&P 500 to further expand on this analysis. Looking back over the past 16
quarters, we looked at the price reaction following every earnings release for
every company. “Big Drops” were identified as anything less than -5%. We subsequently looked at both the absolute and relative performance of these companies over the ensuing 1,2,3,4 weeks to see if these big drops were the beginning of a new trend, or if the share price move on the earnings day was simply an overreaction, with the companies regaining those loses in short order. Granted, looking out just 4 weeks is rather short term, but if the move after earnings is an emotional overreaction, an efficient market should quickly make that up.
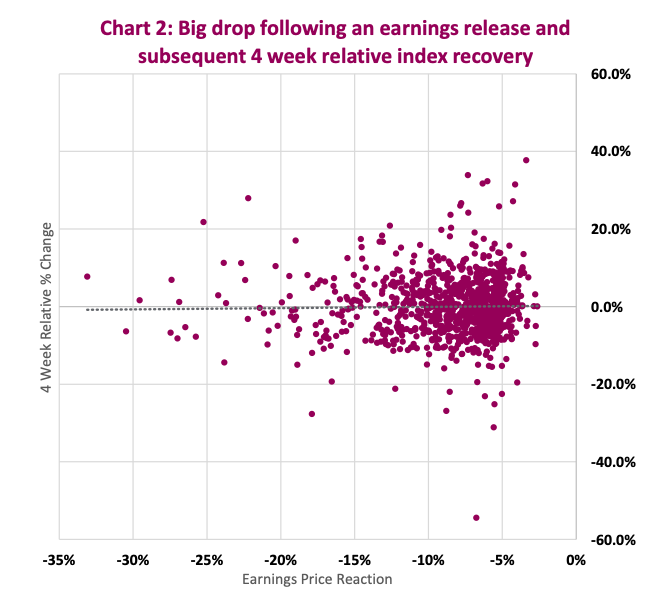
We identified 1,028 instances where companies fell more than 5% on an earnings release. We consider that to be an ample sample size to derive some conclusions. From a high level, it appears that the market does get it right most of the time as you can see in the scatter plot in Chart 2. It’s difficult to determine if there is any clear demonstration of an emotional overreaction, with nearly an even distribution of subsequent winners and losers.

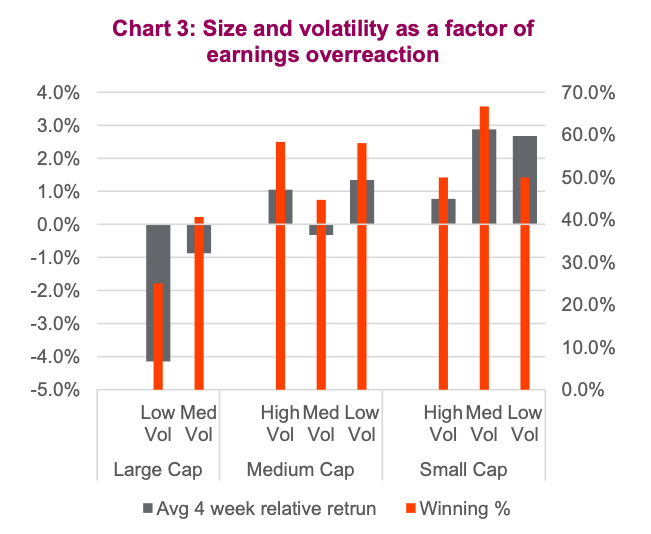
To dig further into this, we then looked into a number of additional variables to see if there are any interesting relationships hidden within the “blob” of dots. These variables included the sector, options market expectations, lead-up performance, volatility, size as well as where the analyst community stood. We have found some asymmetric regression back to the mean as a function of some of these conditions. The most interesting are volatility and company size, with the results seen in Chart 3. Interestingly, this also corroborates with the results of our study.

Quality can mean different things to different investors. For the purpose of this analysis, we view quality as a defensive attribute for companies that experience less share price volatility. Higher-quality smaller companies that suffer a significant price drop on bad earnings tend to recover the loss on average rather quickly. The fact that defense bounces back from misses rather quickly is a sign that quality doesn’t stay down for very long.
The divergence between large and small caps is a little more interesting, but not surprising as smaller companies are typically less followed, have lower volumes and are less institutionally owned. The small-cap space had the top average four-week return, particulalry for low and medium-volatitly stocks. Large-cap high-quality stocks that experienced a “big drop” were the least likely to recover in short order, with an abysmal relative return of -4% over the next four weeks and a winning percentage of just 25%. Again, this makes intuitive sense because if large-cap (>$80 billion market cap) stocks experience a large drop following an earnings release, it takes a lot more selling pressure to move it 5% lower compared to small-cap stocks which are more thinly trade. Those sellers are selling for a reason and not just on an emotional whim.
Investment Implications
When companies report earnings there is a lot of new information to be absorbed by investors. This often causes investors to take action and either buy or sell shares of the company. When many take action, this can lead to an overreaction in the share price. This overreaction appears to be influenced by company size and historical volatility. This is certainly food-for-thought as we progress through Q3 earnings season.
Twitter: @ConnectedWealth
Any opinions expressed herein are solely those of the authors, and do not in any way represent the views or opinions of any other person or entity.


