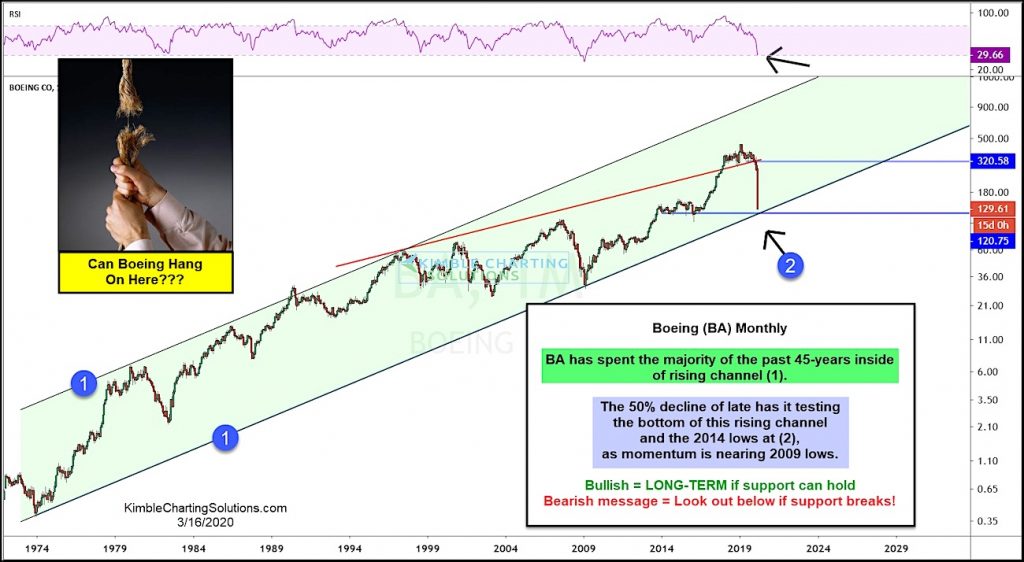
Boeing “monthly” Chart Since 1974
The past month has been tough one for businesses, and especially tough for the airlines.
The coronavirus (COVID-19) fears have sparked travel bans and mass shutdowns, bringing global travel and tourism to a halt.
This uncertainty has sparked a major stock sell-off for blue-chip airlines maker, Boeing (BA).
For the past 45 years, Boeing’s stock price has traded within a rising bullish channel (1).
But the 50 percent decline of late has BA testing the bottom of this rising trend channel at (2). The stock is also testing its 2014 lows.
The simple message of this long-term dual support? Bullish if it holds, bearish if it doesn’t. Stay tuned!
Note that KimbleCharting is offering a 2 week Free trial to See It Market readers. Just send me an email to services@kimblechartingsolutions.com for details to get set up.
Twitter: @KimbleCharting
Any opinions expressed herein are solely those of the author, and do not in any way represent the views or opinions of any other person or entity.


