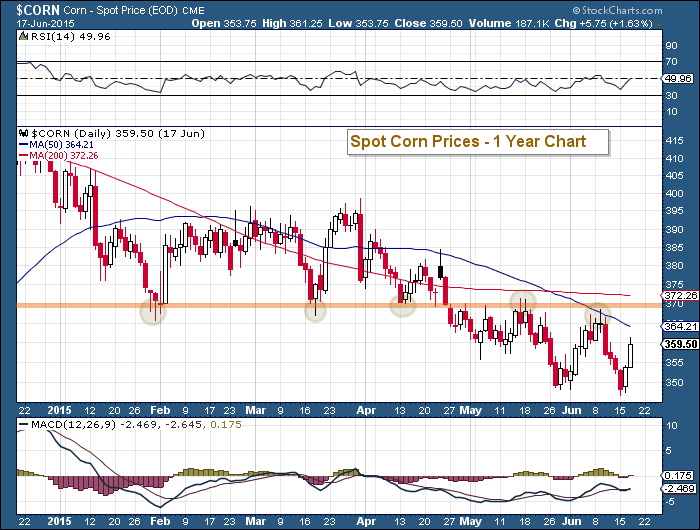
Lots of questions remain around Corn prices, and ag commodities in general. It’s been a while since I looked at Corn, so it’s time for an update. Throughout the first 3 months of the year, I highlighted a key fibonacci retracement level on Spot Corn prices many times – $3.67. Corn tested this level several time before heading lower in April.
I pointed out in March why this Fibonacci level was a must hold and the potential ramifications of losing it:
If Corn can take out $4.00, it will increase the probability of a retest of the December highs. On the flip side, the March lows are now a must hold.
Since losing that level, spot Corn prices have retested it from the bottom side twice (it’s now resistance). Check out the chart below.
Spot Corn Prices Chart (2015)
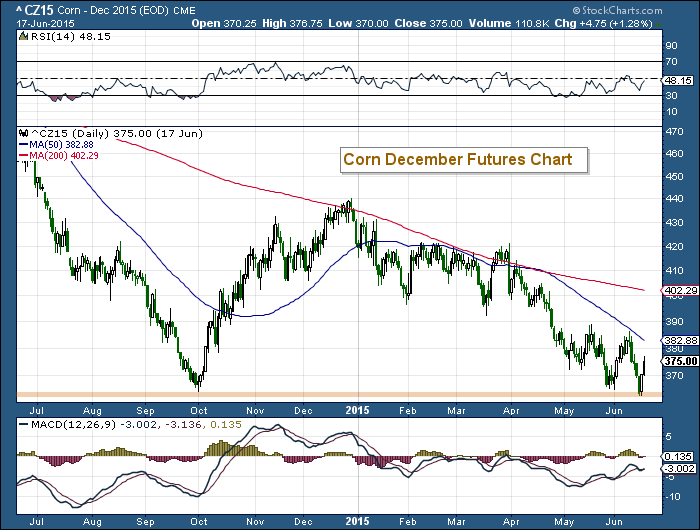
And it’s also worth noting that the most recent swing lower did indeed test the 2014 lows. Let’s now turn to a more relevant view of the December Corn Futures. Here you can see the retest of the lows this week and subsequent rally.
Clearly Corn prices are under pressure here. Notice how its RSI has remained under 50 since early April.
So what would change the situation? Well, a break back above 3.70 (December Corn) would go a long ways to neutralize any selling momentum. It would also be important to see RSI break above and hold the 50 RSI level.
December Corn Prices – 1 Year Chart
Thanks for reading.
Twitter: @andrewnyquist
The author does not have a position in any of the mentioned securities at the time of publication. Any opinions expressed herein are solely those of the author, and do not in any way represent the views or opinions of any other person or entity.


