 After another leg down in September and early October, Corn prices bottomed and have been rallying ever since. I’ve covered Corn quite a bit recently and my last post looked at Corn’s breakout over $3.70. With Corn prices above $4.00, it’s time for a quick update.
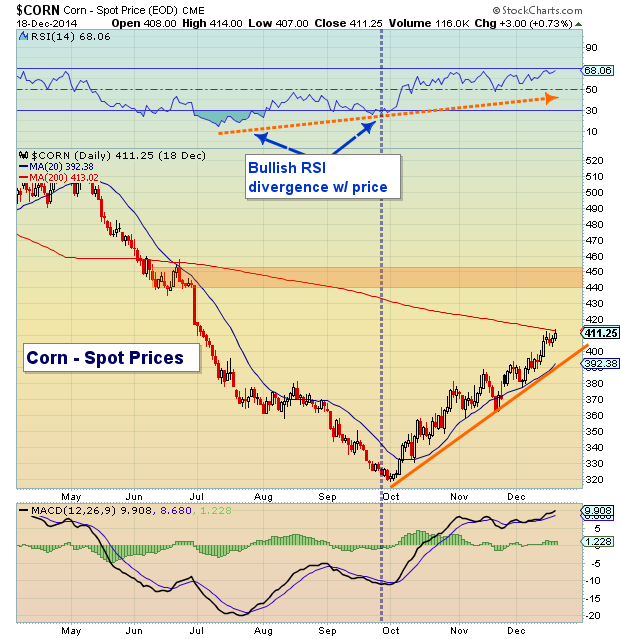
In the chart below, the first thing that stands out to me is the nice rounded bottom. That’s a very bullish pattern and it was the impetus for this current move higher. Also note that the trend higher (orange dotted line) is intact. For the near-term, this gives traders a good reference point. The uptrend line is currently around $3.90, so traders would like to see that level hold. Lastly, the RSI is nearing overbought, but is in an uptrend and still has room to go higher into January if it wants to.
So what price levels am I watching on the upside? First and foremost, the $4.15-$4.25 area poses immediate resistance. It’s where the 200 day moving average resides and marks the bottom of a big late summer down day. Consolidating in and around here would allow the 50 day moving average to play catch up. A break above this level will likely target $4.35-$4.50.
Corn Prices – Daily Spot Chart
It’s also worth noting that this rally has occurred in the face of a stronger US Dollar. And any pullback in the Dollar could assist in propping up Corn prices. Thanks for reading and have a great weekend.
Follow Andrew on Twitter: @andrewnyquist
No position in any of the mentioned securities at the time of publication. Any opinions expressed herein are solely those of the author, and do not in any way represent the views or opinions of any other person or entity.


