Copper has long been a barometer of economic health, so when the shiny metal starts to fall sharply, it begs the question: what’s going on here?
Well, no argument here, Copper is a pretty amazing metal. But what makes this post worthy is that there is quite a story building with regards to the price PATTERNS. I’ve done quite a bit of work on Copper and you can read more by clicking here.
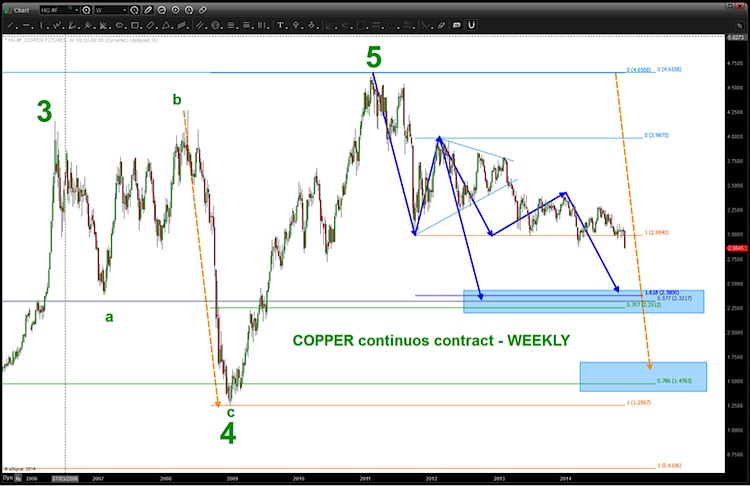
A case can certainly be made that Copper is acting in accordance with a MAJOR correction at hand after 5 major waves complete. And several traders are taking note of its current drop as it broke down pretty big on Friday.
So, as we watch China cut its rates (and everyone else for that matter – man this is getting ugly) I want to point out 2 things: 1) Copper has a lot lower to go and 2) China and Copper are linked/synced pretty well. The charts ALWAYS tells the story so let me present a few charts for you to study.
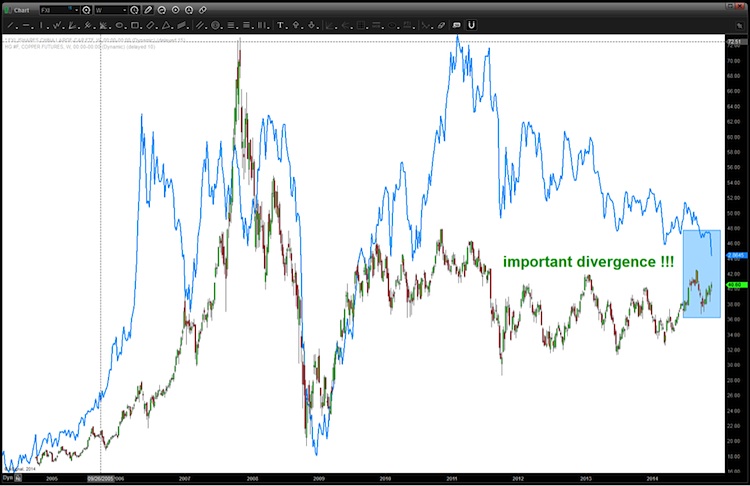
The most recent divergence between the Chinese ETF (FXI) and Copper (highlighted blue rectangle) is important …one of them will get back in line.
- Will FXI explode to the upside and bring Copper up w/ it?
- Will Copper sell off viciously and take FXI down w/ it?
Just be sure to pay attention folks…
The chart below is an overlay of China, as represented by FXI and Copper. FXI is the candles and Copper is the line. NOTE: EVERY HIGH AND LOW OF THE FXI CORRESPONDS TO A HIGH OR LOW IN COPPER PRICES. HOWEVER, they are equal and opposite so – probability favors one of them syncing back up.
Here’s the initial targets on copper… sure looks like it’s going to put some pressure on FXI.
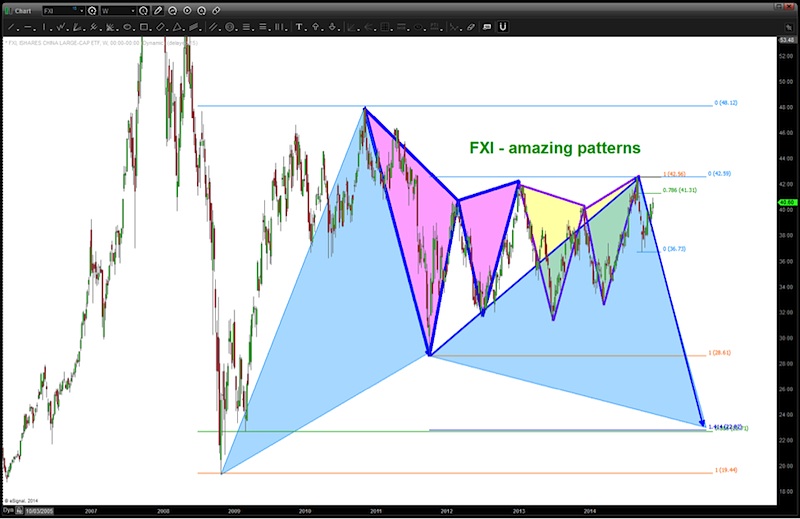
Here’s the FXI… I’m thinking that it should start down in/around here – AMAZING PATTERNS in my opinion.
Trade safe and have a great week. Thanks for reading.
Follow Bart on Twitter: @BartsCharts
No position in any of the mentioned securities at the time of publication. Any opinions expressed herein are solely those of the author, and do not in any way represent the views or opinions of any other person or entity.


