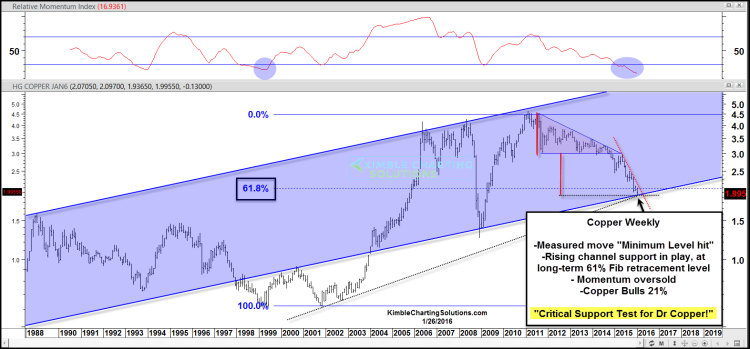
Dr. Copper has often been pointed to as a barometer of global economic activity. If that’s the case, then investors are right to be concerned. Copper prices have declined nearly 40 percent in the last 18 months (and nearly 20 percent over the last 4 months alone).
Due to the headline grabbing collapse in Crude Oil, the decline in Copper prices hasn’t received nearly the attention it should, in my humble opinion.
Why? Because Copper prices are testing an extremely important trend line support level. Should this support break, it would open up the possibility of a much more significant decline (that would likely have ramifications for the global economy… and our investing portfolios).
The commodity complex has been hammered. If Copper signals an “even deeper” decline by breaking support, that would hit an asset class that saw Crude Oil touch down near $26 (last week), Natural Gas hit a $1.70 (in December), Gold hit 5 year lows, and the grains get beaten up.
So let’s hear some good news… here’s why Copper prices have the potential to bottom here:
- The rising trend line support helped to halt the sharp decline in Copper prices in 2008. As well, the trend line comes into play at the 61.8% Fibonacci retracement support level.
- Momentum is oversold.
- Copper prices have declined to the minimum “measured move” target after falling out of triangle pattern in late 2014.
- Sentiment is in the gutter (a contrarian indicator). Currently, Copper bulls are at 21 percent.
Copper Prices Chart – A critical test of support is at hand!
While a turnaround here is a distinct possibility, it is also possible for a further breakdown (and deeper decline). So keep an eye on Dr. Copper here – it’s a big test for copper prices!
Thanks for reading.
Twitter: @KimbleCharting
The author does not have a position in the mentioned security at the time of publication. Any opinions expressed herein are solely those of the author, and do not in any way represent the views or opinions of any other person or entity.


