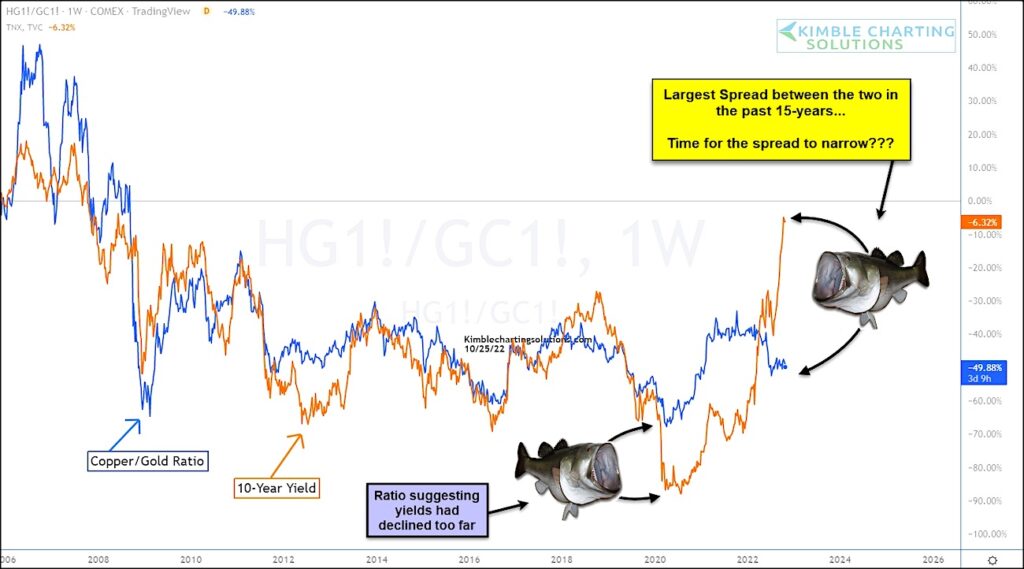
The price of copper to gold has been a correlation that has followed 10-Year US Treasury bond yields (in trend) fairly closely.
This correlation has been one that I’ve followed to see if bond yields are changing trend, or if the trend has become overdone.
Today, this trend is on our radar as inflation is a major nemesis and the Federal Reserve is raising interest rates very quickly. This has spurred a fast rally in 10-year yields.
Below is a long-term chart highlighting the Copper/Gold ratio versus the 10-year treasury bond yield. As you can see, the two tend to follow each other in trend. The spread between the two is its widest in a couple of decades right now, with the 10-year bond surging higher.
Is it time for the spread to narrow? Seems likely…
IF not, this would suggest some credit quality issues in U.S. Government bond paper and that would be whole other concern. Keep an eye on this and stay tuned!
Copper/Gold Ratio vs. 10-Year Treasury Bond Yield Chart

Note that KimbleCharting is offering a 2 week Free trial to See It Market readers. Just send me an email to services@kimblechartingsolutions.com for details to get set up.
Twitter: @KimbleCharting
Any opinions expressed herein are solely those of the author, and do not in any way represent the views or opinions of any other person or entity.


