Copper prices rallied into early 2018 before giving way to a pullback into late 2018.
That pullback was fairly sharp, but found support.
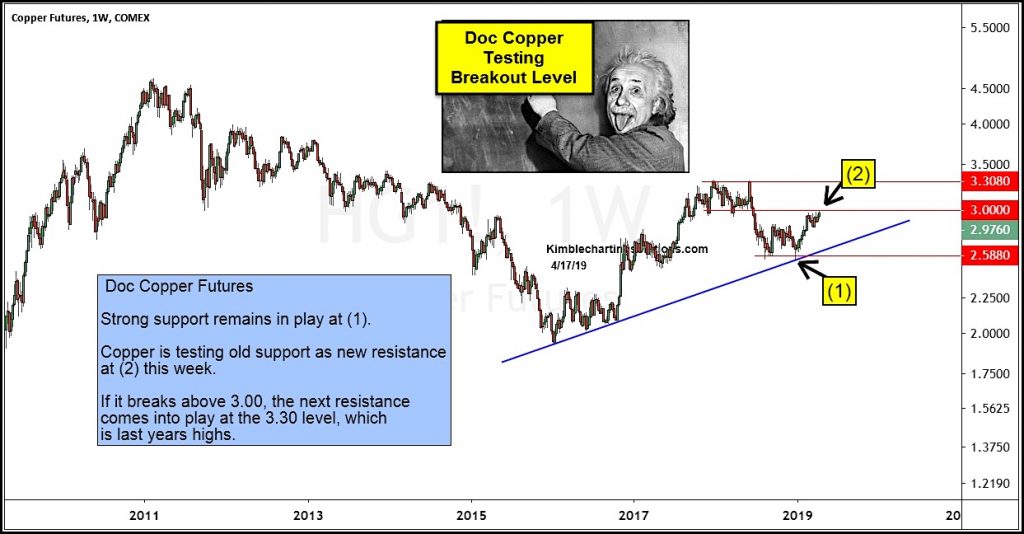
In today’s chart we look at copper futures and highlight what appears to be a bullish setup for Doc Copper.
The 2018 pullback found support at the rising uptrend line (1). A reversal higher predicted a bullish wick and the rally was on.
Doc Copper is currently testing the top of its trading range and the seen of its last breakdown (2).
If Copper breaks above $3, it could rally to $3.30 before hitting its next price resistance level. We don’t want to get ahead of ourselves, but that would setup a major showdown. Stay tuned!
Copper Futures “weekly” Chart

Note that KimbleCharting is offering a 2 week Free trial to See It Market readers. Just send me an email to services@kimblechartingsolutions.com for details to get set up.
Twitter: @KimbleCharting
Any opinions expressed herein are solely those of the author, and do not in any way represent the views or opinions of any other person or entity.


