Copper prices have continued to fall and this decline seems to be in alignment with potentials talks of Federal Reserve interest rate cuts.
When Doc Copper turns south, it’s worth taking note.
Earlier this summer, we wrote the bearish price reversal in copper and what the implications for interest rates might be. You can read that article HERE.
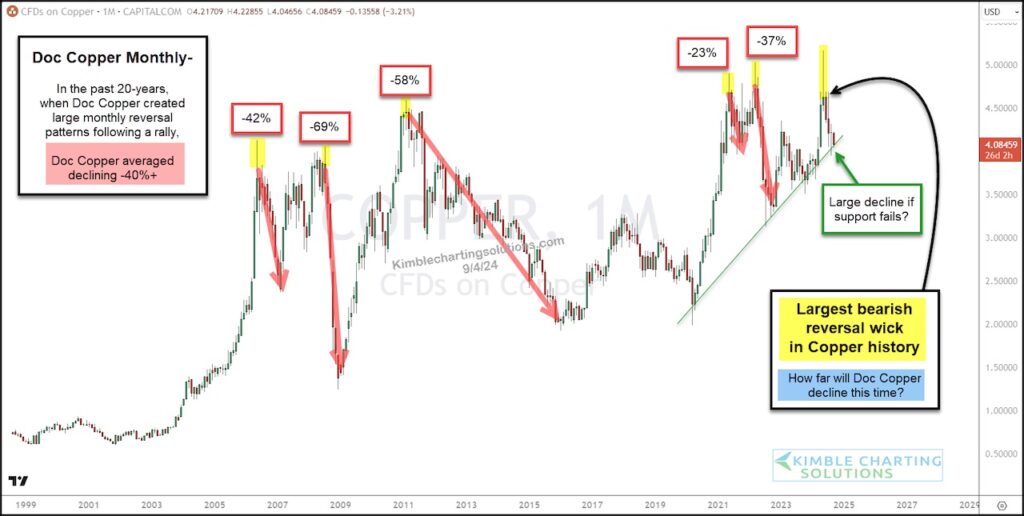
Today we provide an updated “monthly” chart to once again highlight this massive bearish reversal pattern.
As you can see, Copper is down nearly 20% since the massive wick 5-months ago. And it is currently testing important 5-year price support this month… just as the Fed contemplates rate cuts.
In my humble opinion, another important message by Doc copper will be sent by what happens at this 5-year rising support line. Stay tuned!
Copper “monthly” Price Chart
Note that KimbleCharting is offering a 2 week Free trial to See It Market readers. Just send me an email to services@kimblechartingsolutions.com for details to get set up.
Twitter: @KimbleCharting
The author may have a position in mentioned securities. Any opinions expressed herein are solely those of the author, and do not in any way represent the views or opinions of any other person or entity.

 and Semiconductors (SMH): Concerning Price Pattern?")


 and Semiconductors (SMH): Concerning Price Pattern?")

