The “consumer” a critical piece to the economy. And therefore a critical component to the broader stock market.
Even if you don’t trade the Consumer Discretionary ETF (XLY), you can follow it as another indicator on your radar.
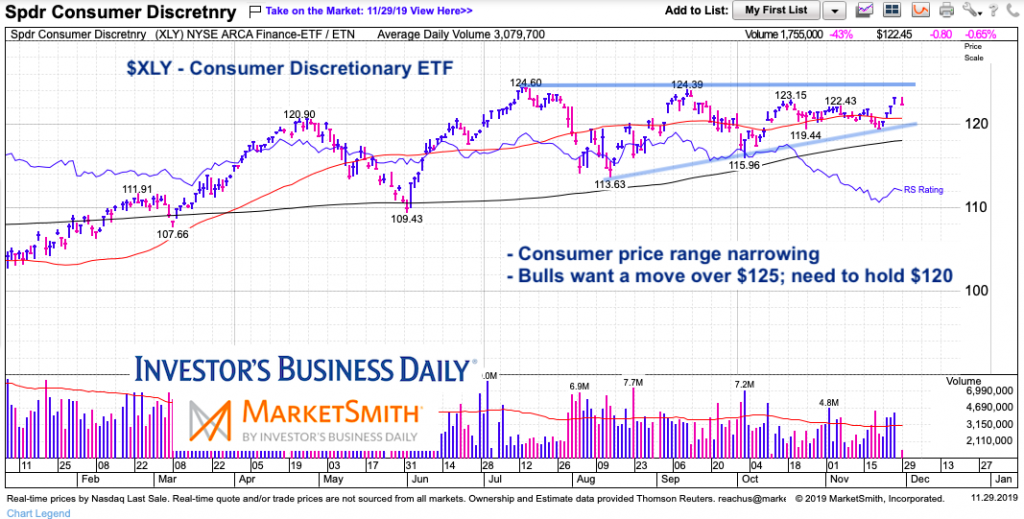
After reversing higher on Friday November 22, the Consumer ETF (XLY) put in four days of gains before cooling off into this Friday’s close. So what’s next?
In today’s chart, we will take a simple, yet valuable, look at $XLY and highlight why investors should keep an eye on it.
Note that the following MarketSmith charts are built with Investors Business Daily’s product suite.
I am an Investors Business Daily (IBD) partner and promote the use of their products. The entire platform offers a good mix of technical and fundamental data and education.
$XLY – Consumer Discretionary ETF “daily” Chart
As you can see below, the consumer ETF (XLY) topped out in Mid-April. This came two weeks before the S&P 500 top. Also, XLY topped in July one week before the S&P 500.
It’s also notable that this broad consumer ETF has yet to confirm the recent stock market breakout – it has yet to breakout above the July highs.
Bulls would like to see a move over $125. Bears would like to push price below $120. The price range is narrowing and perhaps the next “break” will determine higher yet or pullback.

Twitter: @andrewnyquist
The author may have a position in mentioned securities at the time of publication. Any opinions expressed herein are solely those of the author, and do not in any way represent the views or opinions of any other person or entity.


