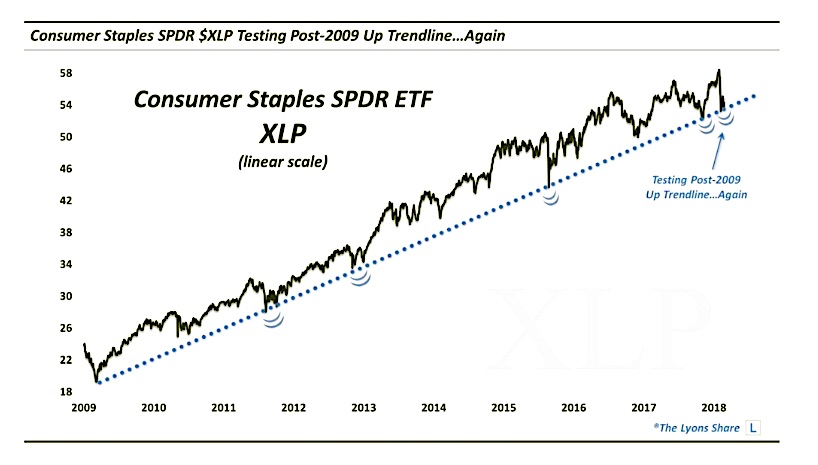
An Up-trend line has supported a popular consumer staples ETF without fail on several occasions since the 2009 low; it is under attack again at the moment.
We can glean a lot about the state of the overall stock market during a correction and its reaction.
One interesting observation from the current correction comes from an inspection of the market segments and sectors that are breaking down vis-a-vis their longer-term uptrends. Or perhaps I should more accurately say not breaking down.
As far as sectors go, obviously energy has had its challenges in recent years. Outside of that sector, however, probably the only one that we can say has really broken down is the utility sector. Given that minimal longer-term damage, we can reasonably suggest that, despite the recent rout, the longer-term bull market remains substantially intact. Obviously that characterization would change should we start seeing more sectors break down. As it happens, one steady bull market climber is seeing its uptrend being tested at the moment.
We mentioned in October that the Consumer Staples SPDR ETF (ticker, XLP) was testing an Up trendline that had been in place since the 2011 low and that had supported the ETF the several times that it was tested over the past half dozen years. Well, as it turns out, one could have extended the trendline back further and it would have intersected right at the low in March 2009. Thus, the trendline also held in 2011, and it held again in October. So, we are talking about a pretty well established trendline, and an important one in the context of the post-2009 bull market.
We bring it up again because XLP is testing the trendline presently once again.
This trendline may not be life or death for the broad stock market. It may not even be life or death for the XLP, though a decisive break certainly would not be a positive for the ETF. But a break would be one of the first subtle red flags in a market that has done very little wrong, as far as the longer-term uptrend is concerned, over the past 2 years.
It may not be flashy, but it is a development that bears watching.
If you’re interested in the “all-access” version of our charts and research, please check out our new site, The Lyons Share. You can follow our investment process and posture every day — including insights into what we’re looking to buy and sell and when. Thanks for reading!
Twitter: @JLyonsFundMgmt
The author may have a position in mentioned securities at the time of publication. Any opinions expressed herein are solely those of the author, and do not in any way represent the views or opinions of any other person or entity.


