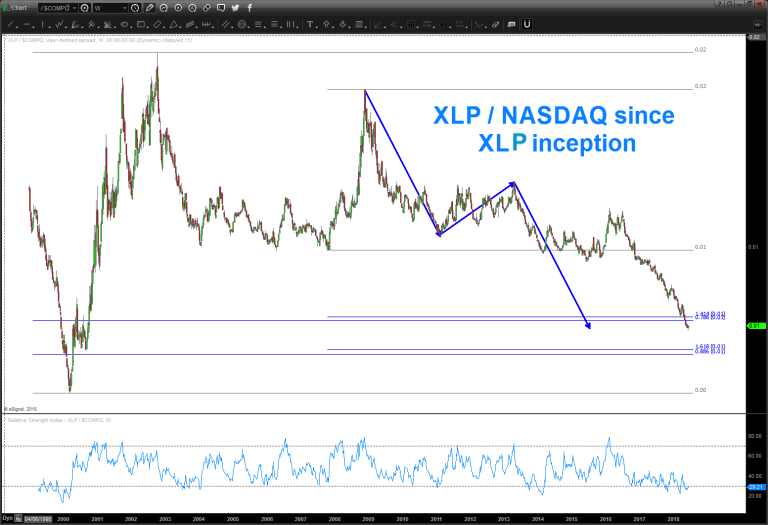
A couple weeks ago, I posted a couple charts using the relative strength of the consumer staples (NYSEARCA:XLP) versus the NASDAQ Composite (INDEXNASDAQ:.IXIC).
Those charts are included below.
Here are some highlights that are worth noting:
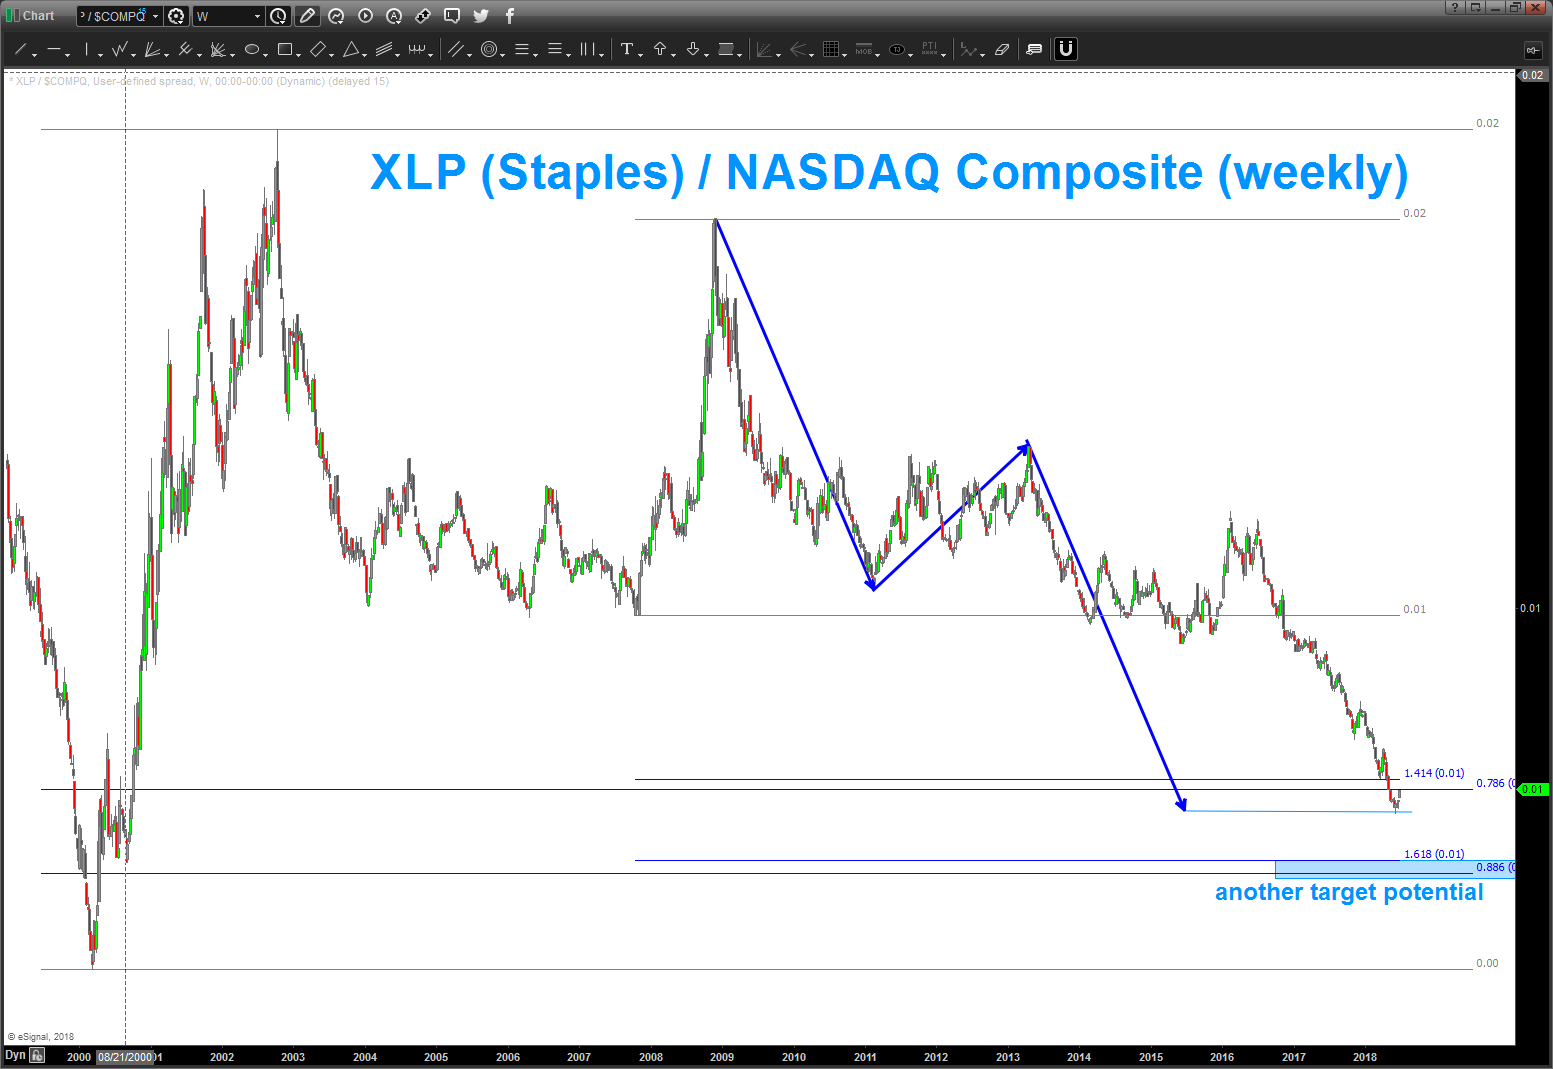
1. The AB=CD projection pattern was completing w/ a bullish hammer.
2. The RSI is pegged at the lowest levels since 2000 and is was showing bullish divergence.
3. The ratio is below the key .786 retracement but NOT at all time lows vice the NASDAQ Composite which was hitting all time highs.
4. There is another level lower (.886 retracement w/ 1.618 extension)
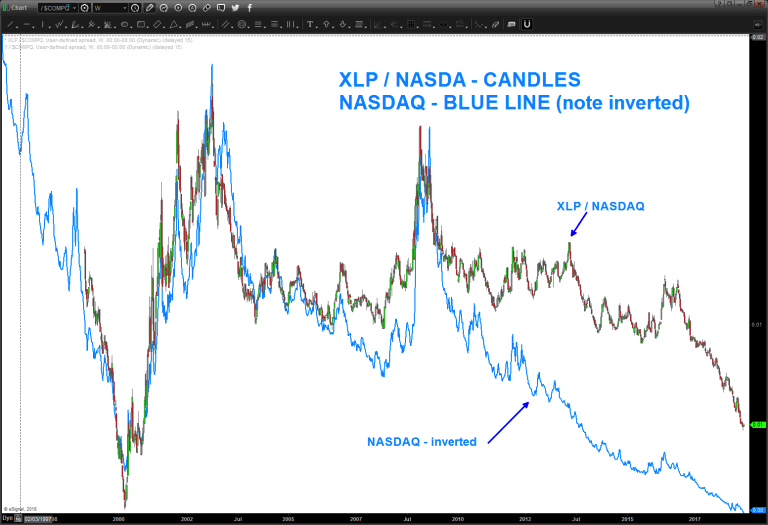
To see how valid this ratio was at helping find POTENTIAL inflections, I overlaid an INVERTED chart of the NASDAQ Composite on top of the XLP/NASDAQ ratio.
As you can see, the pivots were pretty important in the historical framework of the NASDAQ. Every major inflection UP or DOWN corresponded to the ratio finding pivots.
Based on the most recent price action today (as of 06/25/18) I am planning to remain defensive with regards to technology. As we can see below, a technical analysis classic ‘return to the neckline’ could be in the works which would mean the institutional players are rolling into a risk off mindset causing the Staples (from a relative strength perspective) to outperform Technology and causing further weakness and consolidation in the NASDAQ Composite. We shall see… one step at a time.
Be sure to check out my unique analysis of stocks, commodities, currencies over at Bart’s Charts. Stay tuned and thanks for reading.
Twitter: @BartsCharts
Author does not have a position in mentioned securities at the time of publication. Any opinions expressed herein are solely those of the author, and do not in any way represent the views or opinions of any other person or entity.


