Over the last few years, investors have bid up prices of some stocks to historical valuations. Many of these investors are speculating on price and have little appreciation of underlying fundamentals.
Microsoft’s historic stock valuation in the late 90s can teach us valuable lessons about the difference between speculating and adhering to a fundamental framework.
Today we see Tesla (TSLA) shareholders, as an example, believing they are getting in on the rookie year of the next 18-year-old Hank Aaron. Given what they believe is massive upside, they harbor little concern about today’s prices or valuations.
For those investors blind to valuations and playing the hot hand, we wish you luck. But, for the rest of you, we look back at a young Microsoft (MSFT), the Babe Ruth of the equity market. Microsoft’s stock valuation in the late 1990s can teach us a valuable lesson about managing money in times of extreme valuations.
“People who run ball clubs think in terms of buying players. Your goal isn’t to buy players. Your goal is to buy wins” – Moneyball
Microsoft
Bill Gates and Paul Allen founded Microsoft in a garage over 45 years ago. In 1987, the stock went public, ultimately making its initial investors fortunes. A $1,000 investment in MSFT in 1987 is now worth over $1.5 million. Today MSFT has a $2.2 trillion market cap making it the second-largest American company.
Dreams of such enormous returns lead many professionals to advocate a buy-and-hold mindset on some stocks. Anyone that held MSFT for the last 35 years is brilliant. That said, a valuation-oriented approach could have vastly improved their results.
Most of us lack the time and fortitude to hold a stock for decades. Further, it is too easy to fall for the temptation of taking profits versus letting a stock reach its full potential. Regardless, even if we have time, fortitude, and will not yield to temptation, picking the next MSFT, Apple, or Amazon is exceedingly difficult.
Given the difficulties of finding and holding on to the next Micky Mantle, we prefer to heed valuations for guidance. As we will show, a valuation-oriented approach taken with Microsoft stock would yield an early investor even greater returns than the 150,000% its shares gained over the last 35 years.
Exponential Growth
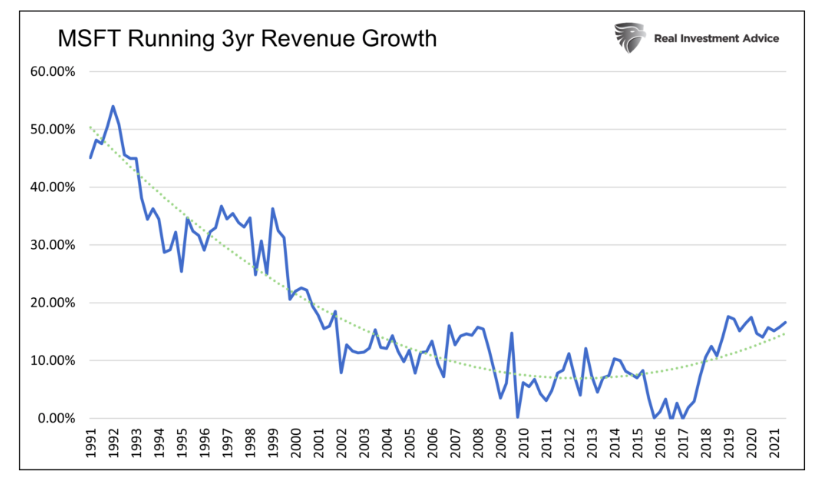
MSFT’s revenue has grown by over 40,000% since 1987, yet its revenue growth rate has declined for most of the last 30 years. This is no fault of MSFT’s management. Almost all companies find revenue growth decreases over time for two reasons. First, desirable products tend to saturate the market, leaving fewer buyers in the future. Second, new entrants see the product’s popularity, its potential profits, and come to market with competing products.
MSFT has a rare advantage in a limited competition for its core Office product. Even better, its customers are dependent on its software and need to buy updates regularly.
Despite its unique advantages, MSFT’s revenue growth rate consistently fell despite the rising popularity of its core product. Its growth has picked up in recent years due to cloud computing and gaming. Given the competitiveness of those endeavors, we expect growth will falter again.

Any investor that accurately foresaw Microsoft’s tremendous growth was likely blinded by how big MSFT could become. Thus, while the narrative in the late 1980s was compelling, opportunities to profit from its shares ebbed and flowed over the next forty years.
In January 1993, Microsoft stock was trading at a split-adjusted price of $1.73 with a price-to-earnings (P/E) valuation of 10. Despite marginal earnings growth, hefty revenue growth indicated that MSFT could grow earnings in the future. In time, that is what happened. From 1992 to 1997, their earnings per share growth was nominal despite revenue growing 5x over the period. Over the next five years, earnings per share caught up, growing 2.5x despite a recession.
An Expensive Ty Cobb
We can think of a baseball team as a portfolio of players. Given salary cap constraints, teams are limited in how much they can spend on salaries. The risk they face is paying too much for one player, leaving not enough for the rest of the team. Such is often the recipe for a sub-par record.
Managing wealth is similar in that we also have a limited amount of money to allocate. While companies like MSFT may appear to be great purchases, we must always consider the opportunity cost. If we overpay and allocate too much for a stock, not only are we likely to have underperformance, but we also forgo the opportunity to buy stocks with more rewarding valuations.
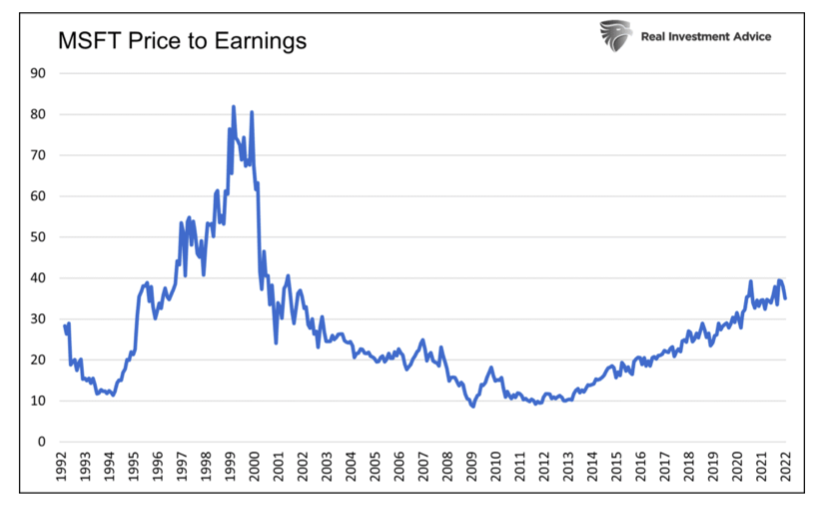
The graph below shows Microsoft’s stock price-to-earnings (P/E) valuation. In retrospect, the company was dirt cheap in 1993 and 1994 with a P/E of 10. Also, benefitting from hindsight, the company was grossly expensive with a P/E of 80 in the late 1990s.

From 1993 to the eve of the dot com bust in 2000, MSFT shares rose 1,868%. Over the same period, sales growth was up 490%. Not only did the stock price catch up to its revenue growth and profit potential, but it well surpassed it.
In the late 1990s, MSFT investors were betting the company could grow earnings at many multiples of the market rate. That was an impossible feat even for a company like MSFT.
Failed Expectations
From 2000 through 2010, MSFT grew its earnings per share (EPS) by 11.7%. The rate was a little more than double the 5% rate of the S&P 500. While a spectacular ten-year growth rate, it fell short of the high valuation premium priced into the stock in 1999.
With foreknowledge that MSFT’s earnings would grow twice the rate of the market, a fair value P/E ratio on MSFT in the late 1990s was two times that of the S&P 500. The average S&P 500 P/E from 1980-1999 was 17.5. Therefore, one could make the case a fair P/E valuation for Microsoft stock was about 35, meaning its price, on the eve of the dot com crash, was overvalued by 58%. Even compared to the record S&P 500 P/E of 29 in late 1999, investors were still overvaluing MSFT by 30%.
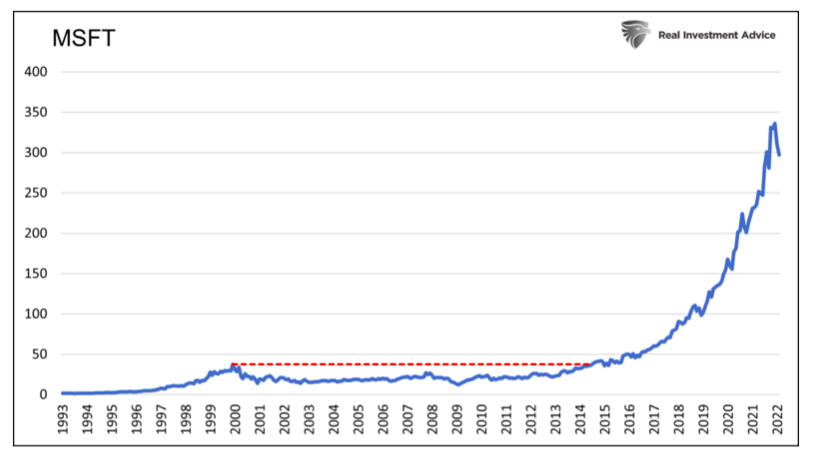
As shown below, investors paid a dear price for ignoring Microsoft’s lofty stock valuation. It took 14 years for its shares to regain the price peak from 2000.

Powerful Narratives
Unlike baseball, investors can buy and sell any stock (player) they wish at any time. They can buy a 20-year-old Willie Mays-like stock with great potential at a low price. They can sell Mays when he is an all-star, and his value far exceeds his worth. When Mays is past his prime, they can add him back to the roster at a fair price despite his declining production.
In the late 90s, the internet and home computing were in their infancy. As a result, it was commonplace to see massive growth projections based on the promise of these new technologies. In the late 1990s, ignoring pie in the sky narratives while heeding the message of valuations would have led an astute investor to either reduce MSFT holdings or sell completely.
The narratives backing MSFT shares and many other technology stocks were compelling. It was hard not to be greedy. The problem was MSFT was priced to bat .600. As a point of reference, In 1941, Ted Williams was the last player to bat above .400.
A Tale of Two Investors
Selling MSFT in 1999 was incredibly difficult, but it was smart.
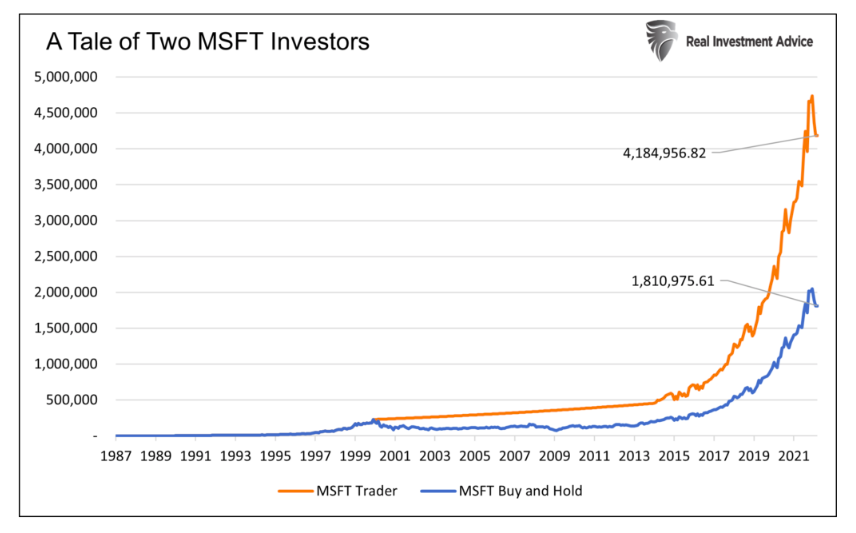
Over the next 14 years, MSFT’s share price went nowhere. A valuation-oriented investor could have sat out the 14 years in the comfort of risk-free U.S. Treasuries yielding approximately 5%. Years later, MSFT was again trading at a P/E of 10. At the time, our prudent investor, who nearly doubled his money with bonds, could have repurchased almost twice as many shares of MSFT as they once held and taken it for another great ride.
The graph below compares two investors who invested $1,000 into MSFT in 1987. The first investor still holds the original shares. The second investor (MSFT trader) sold in late 1999 and skipped the 14 years when MSFT shares went nowhere. During the period, he bought bonds yielding 5%.

Summary
It is easy to sit here in 2022 and tell you what an investor should have done in hindsight. Regrettably, replicating such trading precision is impossible.
When looking forward, not backward, as we must do every day, it’s incredibly challenging to sell companies with massive potential even though they may have extreme valuations. Today, valuations in many cases are like those of the late 1990s. Once again, it feels as if the good times will never end.
Twitter: @michaellebowitz
The author or his firm may have positions in mentioned securities at the time of publication. Any opinions expressed herein are solely those of the author, and do not in any way represent the views or opinions of any other person or entity.


