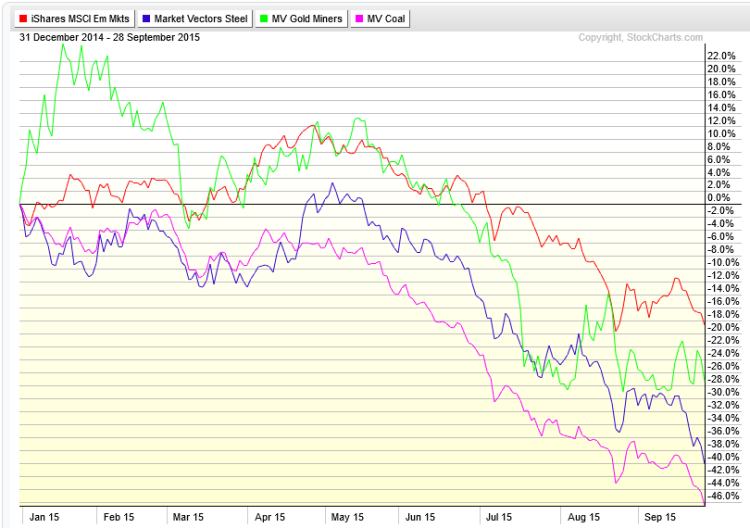
January through much of September witnessed significant weakness in emerging markets (EEM) and essentially anything resource and commodities-related.
Steel companies (SLX), the Gold miners (GDX), and coal stocks (KOL) are three of the commodities-related industries that were the hot ‘reflation’ trade coming out of the 2007-2009 bear market, but then quickly lost favor in middle 2011 as a focus on US outperformance and disinflation ensued.
The chart below reflects the dramatic declines in these industries (and highly correlated ETFs) during 2015. BUT it only goes through September 28. This chart will help to set up the next chart which shows the rally since then.
Shown in chart below: iShares Emerging Markets (EEM), Market Vectors Steel (SLX), Market Vectors Gold Miners (GDX), and Market Vectors Coal (KOL)
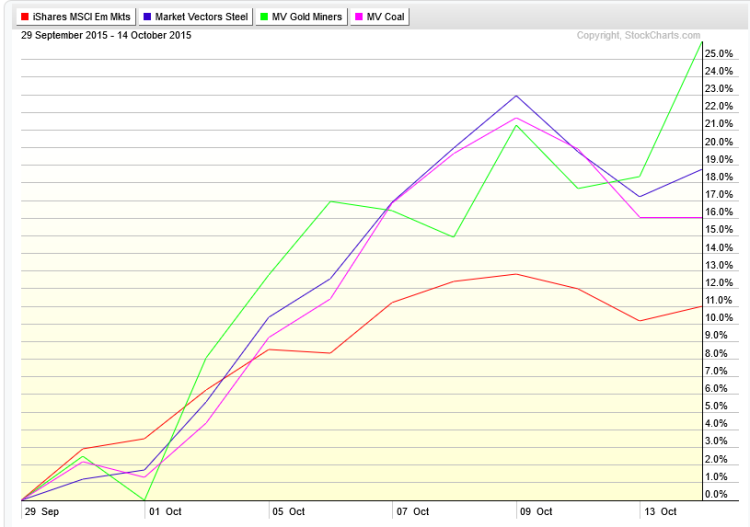
These commodities correlated ETFs reversed to the upside as the calendar flipped to October; all gaining at least 11%.
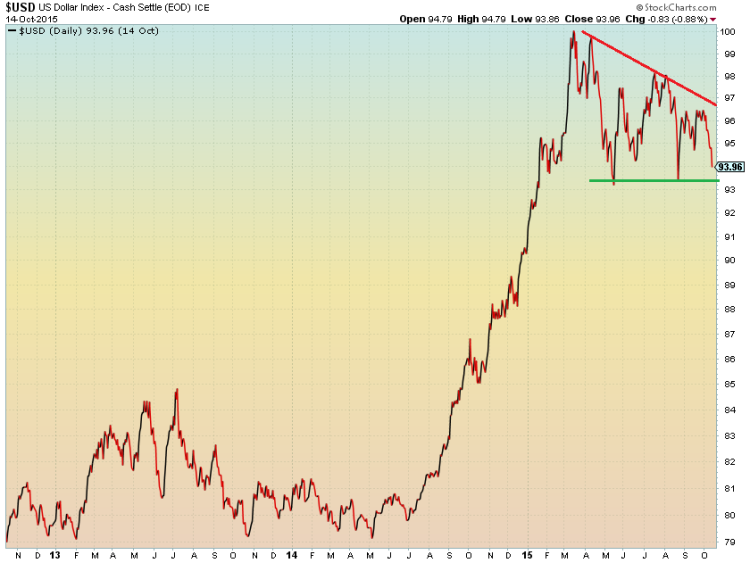
Emerging markets, as well as these sector ETFs, typically do well when the US Dollar declines. The US Dollar ETF (UUP) has declined more than 2% in the last two weeks, certainly giving a bit of a tailwind to these resourced-based industries. Looking at the chart of the US Dollar Index, you can see the clear importance of the 93 level.
Overall, the chart pattern on the USD is a bullish consolidation, with the expectation that the chart resolves higher. Traders always know that even if chart exhibits a bullish pattern, things can go the other way quickly when a support level breaks.
Also read: US Dollar Index Long-Term Bullish Despite Consolidation
A break below 93 would invalidate the bullish consolidation pattern, and would likely mean ‘liftoff’ to EEM, SLX, GDX, KOL.
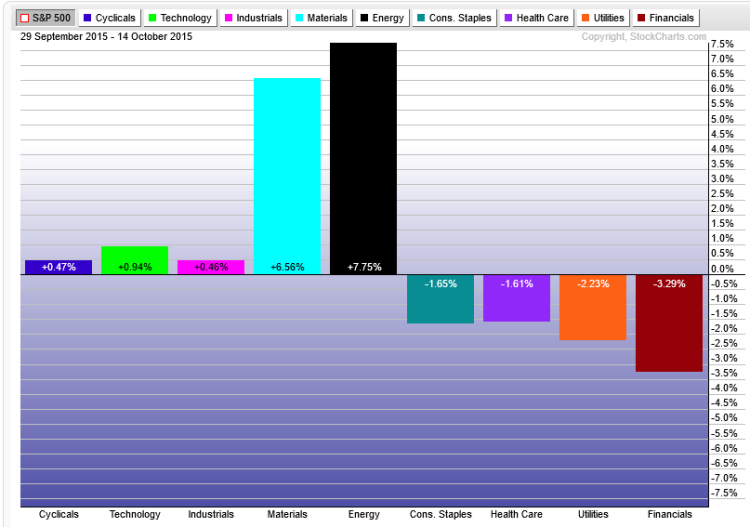
Taking a step back from the narrow focus of industries to the broader sectors of the US market, Energy (XLE) and Materials (XLB) have sharply outperformed the S&P 500 since September 29. The below chart highlights the alpha generated by XLE and XLB. The chart shows performance relative to the S&P 500, which has increased about 6% on its own during this time period. On an absolute basis, the Energy Sector (XLE) is +13% and the Materials Sector (XLB) +12%. Keep an eye on the US Dollar to see if this sector rotation continues through year-end.
Thanks for reading.
Twitter: @MikeZaccardi
No position in any of the mentioned securities at the time of publication. Any opinions expressed herein are solely those of the author, and do not in any way represent the views or opinions of any other person or entity.


