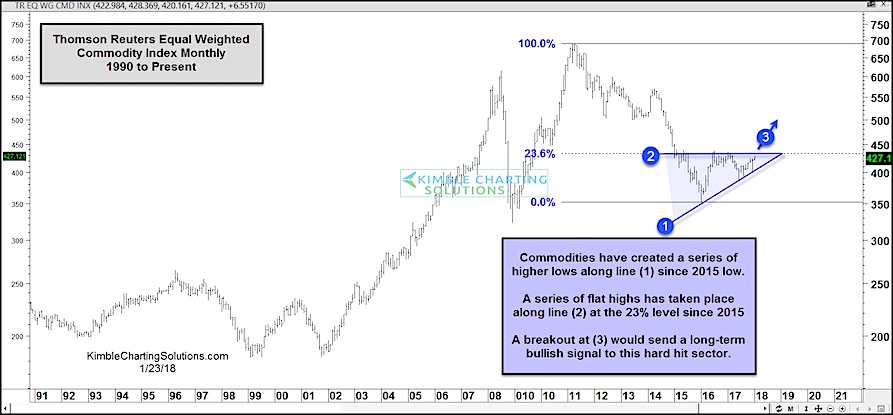
From 2011 to late 2015, the Thomson Reuters Equal Weighted Commodity Index lost nearly half its value as the Gold, Grains, and Energy industries worked their way through bear markets.
Since bottoming in late 2015, commodity prices have made a comeback of sorts, chopping their way higher. Couple this with a U.S. Dollar that is in the throws of a deep correction, and there’s reason to be bullish.
But only the price action can confirm if a trend reversal is occurring.
Will bulls seize the moment?
Looking at the long-term “monthly” chart of the Commodity Index (below), it’s clear that the price action is nearing an important juncture… One that offers opportunity for Commodity bulls.
The Index has formed an ascending triangle pattern. A series of higher lows (off the 2015 low) have formed along trend line (1), while a series of flat highs have been made along line (2) at the 23.6% Fibonacci retracement level.
Note that an ascending triangle pattern is sometimes seen as a reversal pattern marking the end of downtrends. As well, the 23.6 Fibonacci retracement often serves a trend change gauge.
Can commodity bulls break above this price resistance? Stay tuned. A breakout at point (3) would send a long-term bullish signal to investors!
Thanks for reading.
ALSO READ: Bitcoin Volatility Picks Up As Price Declines
Twitter: @KimbleCharting
Any opinions expressed herein are solely those of the author, and do not in any way represent the views or opinions of any other person or entity.


