The US Dollar is closely watched by investors and traders alike… especially those interested in commodities.
When King Dollar is strong, it usually acts as a headwind for Gold, Oil, Natural Gas, etc… and when it is weak it acts as a tailwind.
In 2018, the US Dollar enjoyed a multi-month rally. One that kept commodities in check. But as that rally slowed (and eventually reversed) during the back half of 2018, commodities received a boost.
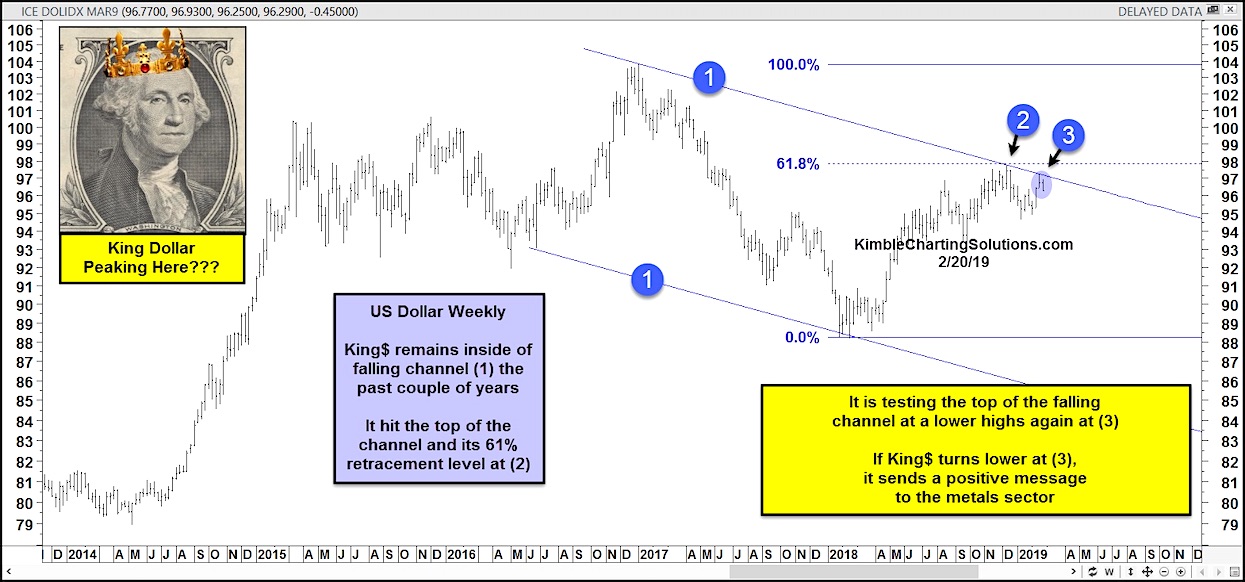
In today’s chart, you can see that the US Dollar has been in a broad down trend over the past 2+ years (1). But the Dollar hasn’t given up… yet.
It rallied to its 61.8% Fibonacci retracement (2) and reversed lower. This resistance level was bolstered by the falling downtrend channel line. US Dollar bears (and commodity bulls) would like to see the Dollar put in a lower high as it tests the downtrend resistance line yet again (3).
A turn lower would be bullish indicator for the commodities sector, while a breakout higher could stall / end the rally for select commodities. Stay tuned!
US Dollar “Weekly” Chart
Note that KimbleCharting is offering a 2 week Free trial to See It Market readers. Just send me an email to services@kimblechartingsolutions.com for details to get set up.
Twitter: @KimbleCharting
Any opinions expressed herein are solely those of the author, and do not in any way represent the views or opinions of any other person or entity.


