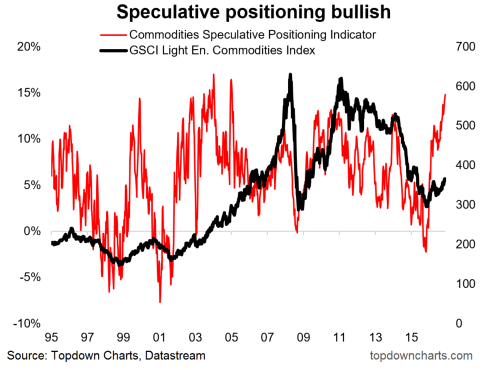
The below chart shows average speculative futures positioning (standardized against open interest*) across 15 different commodities – giving effectively an asset class view for commodities.
The main takeaway is that speculators are the most net-long commodities they’ve been in more than 10 years.
Commodity speculative positioning (futures) at a 10 year high, but so what?
As for the so-what… normally I view speculative futures positioning as a contrarian indicator. That is, when the crowd are extremely bullish, you want to be bearish, and when everyone is too bearish you want to be bullish. This type of trading works well when the market is range-bound.
Where such strategy falls short is when a new trend gets underway. Looking at the chart above you can see a surge in net longs coming out of the 1999 bottom and again off the 2001 bottom as a mighty bull market got underway…
So the question is do you take a contrarian signal from the current extreme bullishness on commodities? Or do you take a view that it’s actually the start of a new bull market?
Based on what we’ve seen in the past, and a couple of other indicators (as discussed in the latest Weekly Macro Themes) I’m leaning towards the latter.
Twitter: @Callum_Thomas
Any opinions expressed herein are solely those of the author, and do not in any way represent the views or opinions of any other person or entity.


