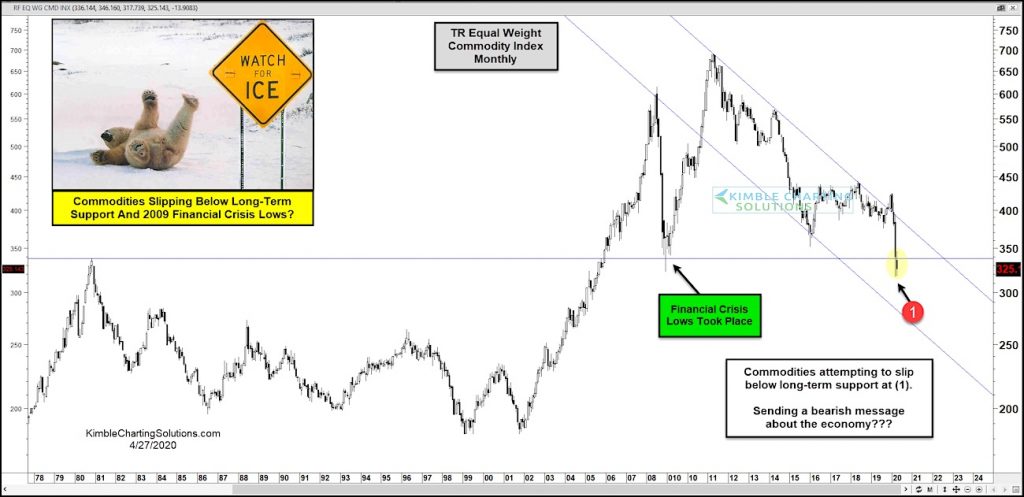
TR Equal Weight Commodity Index “monthly” Chart
Commodities have been hit hard in 2020.
There are few shining stars in this asset class. One of those shining stars is Gold… but even it’s little brother Silver is down sharply this year.
Crude Oil has experienced a price crash. Natural Gas is lower. Corn, Soybeans, and Wheat are down.
All of this shows up in today’s chart of the TR Equal Weight Commodity Index. As you can see, the Equal Weight Commodity Index is testing long-term support at (1).
The index is also slipping below the Financial Crisis lows. Without an immediate sharp recovery, commodities are sending a bearish message about the economy to hopeful bulls. Stay tuned!
Note that KimbleCharting is offering a 2 week Free trial to See It Market readers. Just send me an email to services@kimblechartingsolutions.com for details to get set up.
Twitter: @KimbleCharting
Any opinions expressed herein are solely those of the author, and do not in any way represent the views or opinions of any other person or entity.


