We all knew that coming into Friday with two inside trading days in several instruments meant the range break could be significant.
Looking at the Russell 2000 Index (IWM) for example, the 2 inside days resolved to the downside.
However, the overall trading range, or the one we have been watching throughout September, is now the bigger focus.
September ends on Monday.
The September or one month low in IWM is 146.00. The high is 158.92.
Big range.

The stronger index or S&P 500 Index (SPY) also came into Friday with an inside trading day.
However, it ultimately held the low or 294.33. SPY’s September low is 289.27.
September 2019 will go down in history as the month SPY made a new all-time high.
I know folks want the easy answer. The market has topped or the market is going to new highs.
Yet, what I see are shadows behind a red curtain. But the shadowy silhouette has yet to show us what she’s got.

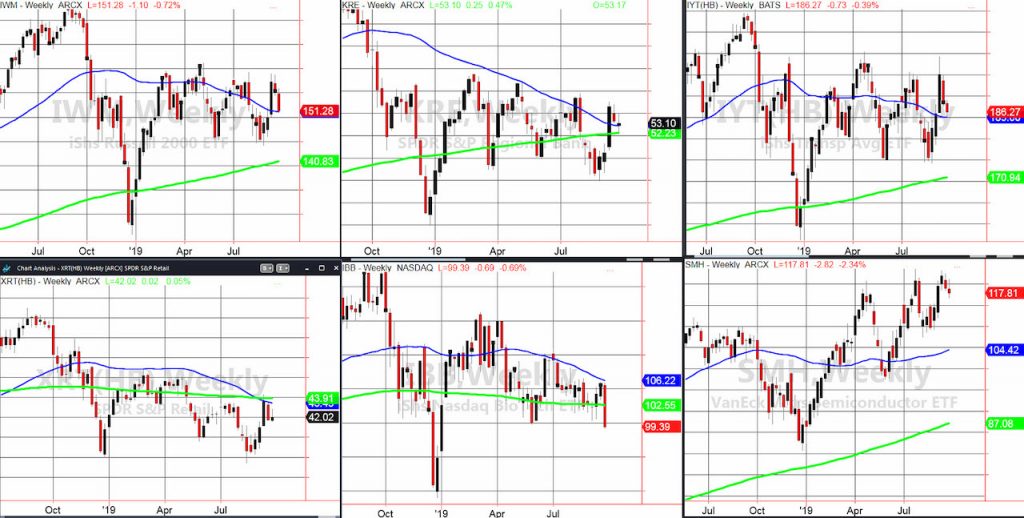
Since we want consistency in a market and world that lacks it, we go to our reliable economic Modern Family’s weekly charts.
Top left is the Russell 2000 IWM. It landed right on the 50-WMA (blue) and closed just on it. 2 weeks ago, the low was 150.06.
In the spirit of the silhouette behind the red curtain, next week should help tell us if the bulls or the bears emerge behind the curtain. Will buyers come back in at the support level? Will sellers take IWM closer to the September lows.
Top middle is the Regional Banks KRE. Anyone who does not respect the accuracy of charts, should look no further than here. KRE sits right on the 50-WMA with the 200-WMA just below it. Key.
Top right is Transportation IYT. IYT also landed on the 50-WMA.
What makes the top row so compelling is how precise the support levels and price show up. Makes it easy, right?
Bottom left is Retail XRT. Speaking of chart precision, XRT has failed at the overhead 50 and 200-WMAs. From a longer-term perspective, 38.00 is the ultimate support. However, a move under 41.15 will hurt (the 50-DMA is there).
Middle bottom is Biotechnology IBB. It looks like the drugs wore off and reality has set in. Under 100, the April low is broken. Next stop should no buyers show up, is 95.00.
Bottom right is Semiconductors SMH. Still the strongest sector of the bunch, SMH failed 120, now the inflection point.
Should SMH break 115, it seems that the double top looks more likely with an expected move down to 104.50 or its 50-WMA.
Should our cloaked performer emerge with strength, always wise to buy the strength as you see in SMH, or even IYT KRE sitting on the support.
Should our cloaked performer emerge with more weakness, IBB, XRT and most likely IWM, will be hit much harder.
S&P 500 (SPY) The 50-DMA at 294.68 now pivotal.
Russell 2000 (IWM) Unconfirmed distribution phase. Support at 150.90, and a move over the 152 would be ideal for the bulls.
Dow Jones Industrials (DIA) Holding above the 50-DMA at 265.91. Has to clear 270 resistance.
Nasdaq (QQQ) Unconfirmed caution phase with a 189 resistance, 185 minor support, and 180 underlaying support.
KRE (Regional Banks) 52.23 to 52.25 the range to break.
SMH (Semiconductors) 116.36 is the 50-DMA.
IYT (Transportation) Unconfirmed caution phase and holding weekly support at 185.
IBB (Biotechnology) 100 now resistance.
XRT (Retail) 42.40 to clear for starters and 41.15 to hold.
Twitter: @marketminute
The author may have a position in the mentioned securities at the time of publication. Any opinions expressed herein are solely those of the author, and do not in any way represent the views or opinions of any other person or entity.


