Cisco Systems was one of those large cap stocks that investors kind of forgot about. But they’d be smart to put Cisco stock (CSCO) back on their watch list.
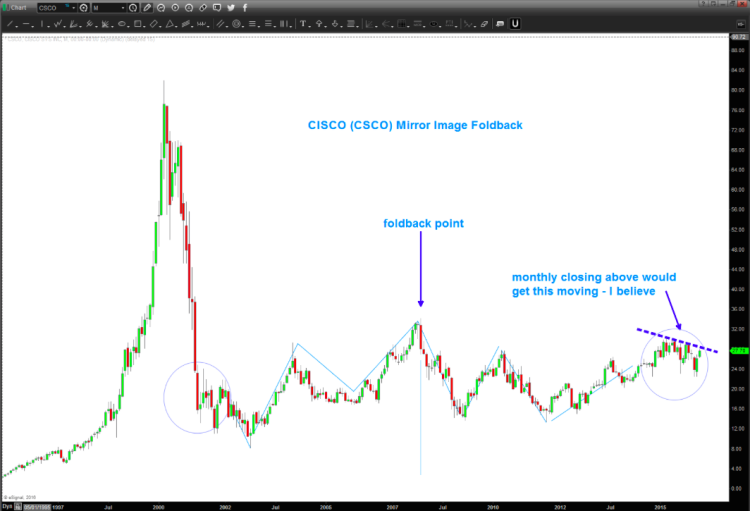
After a slow grind higher over the last few years, Cisco stock price is consolidating and looks like it may be nearing a significant breakout on the monthly chart.
In the chart below, you can see a long basing pattern that also resembles a mirror image foldback. Shares of Cisco stock are now trading at the far end and threatening to breakout.
The consolidation pattern shown below is highlighted by a descending trend line (dotted blue line tracking slightly lower highs). A monthly closing over this line may be enough to get Cisco’s stock engine going. We cannot rule out another pullback, so it’s probably wise to be patient and use discipline with this one.
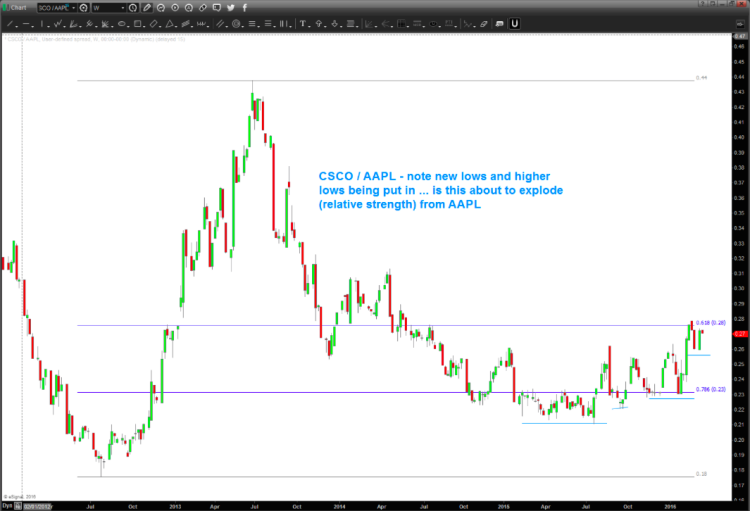
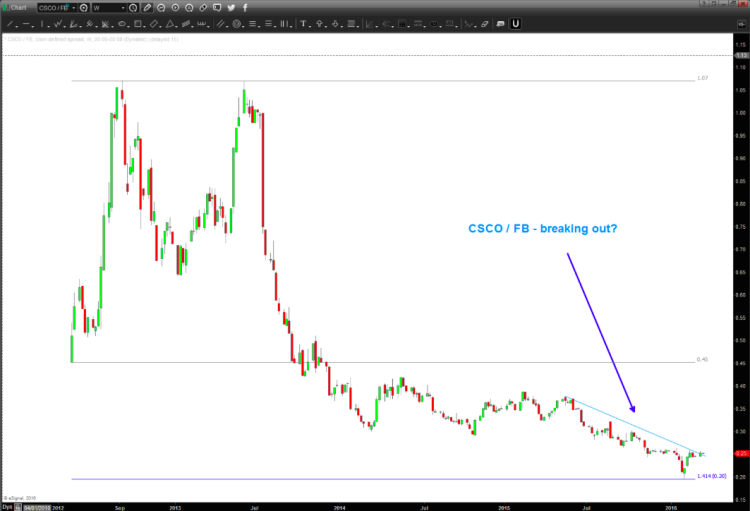
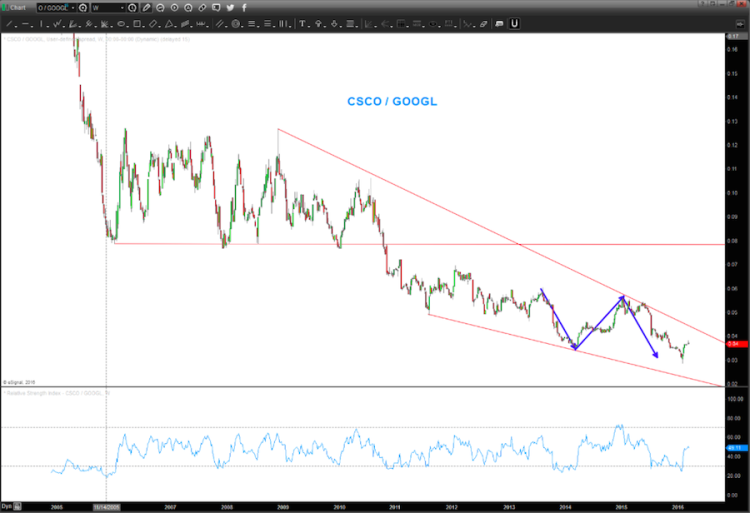
In the charts further down, you can see how Cisco stock is showing relative strength to other big name large cap stocks like Apple (AAPL), Facebook (FB), and Alphabet/Google (GOOGL). If this pattern continues, CSCO may rise again to prominence.
Cisco Stock Chart (CSCO) – Monthly
CSCO/AAPL Relative Strength Chart
CSCO/FB Relative Strength Chart
CSCO/GOOGL Relative Strength Chart
Thanks for reading.
Further reading from Bart: “USDJPY Chart Update: Dollar Yen Ready To Move Again“
Twitter: @BartsCharts
Author does not have a position in mentioned securities at the time of publication. Any opinions expressed herein are solely those of the author, and do not in any way represent the views or opinions of any other person or entity.


