As the eyes of the world are on Russia and Ukraine (and Putin versus Biden), what happens next in the Chinese markets could be a big deal as well!
The Chinese economy has the ability to tip the scales of the global economy and one of its leading indicators is flashing a warning sign.
The Hang Seng (Chinese stock market index)
Today’s chart takes a long-term “monthly” look at one of the most important stock market indices in the world.
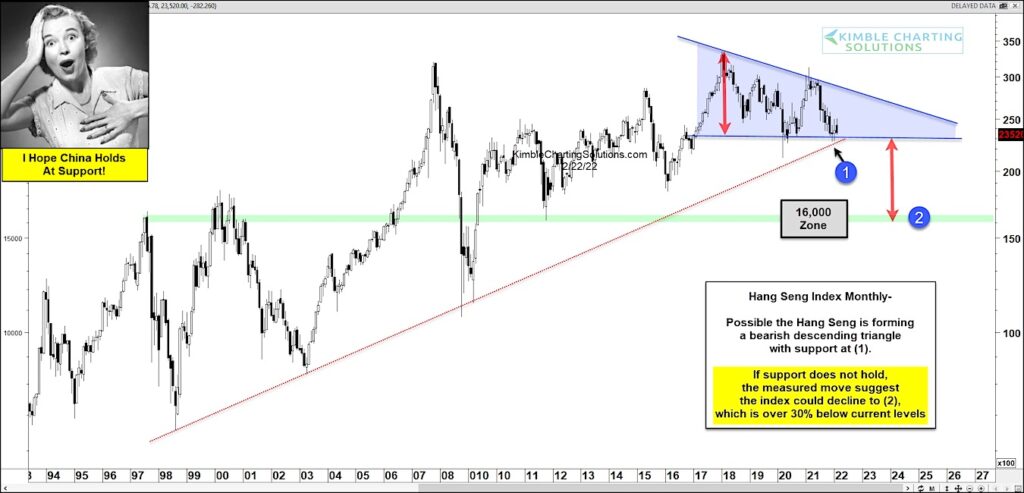
As you can see, the index has spent the past 5 years forming a bearish descending triangle with dual support at (1) – both the bottom of the triangle and long-term uptrend line.
If support at (1) fails to hold, then a measured move may be in play. In this case, a measured move suggests the index could decline to (2), or the 16,000 area, which is over 30% below current trading levels.
Looks like this is an important test of support for China, as well as the world. Stay tuned!
Hang Seng Index “monthly” Chart

Note that KimbleCharting is offering a 2 week Free trial to See It Market readers. Just send me an email to services@kimblechartingsolutions.com for details to get set up.
Twitter: @KimbleCharting
Any opinions expressed herein are solely those of the author, and do not in any way represent the views or opinions of any other person or entity.


