The Shanghai Composite rallied 5.7% in Monday’s trading session as China’s state-run Securities Journal noted the importance of a healthy bull market to the Chinese economy.
This news sent both the iShares China Large Cap ETF NYSEARCA: FXI and Baidu NASDAQ: BIDU soaring in the U.S. session.
As of 1:30 PM ET, FXI is up 8.7% and BIDU is up 6.9%.
In this blog post, we will review our weekly cycle analysis for both FXI and BIDU.
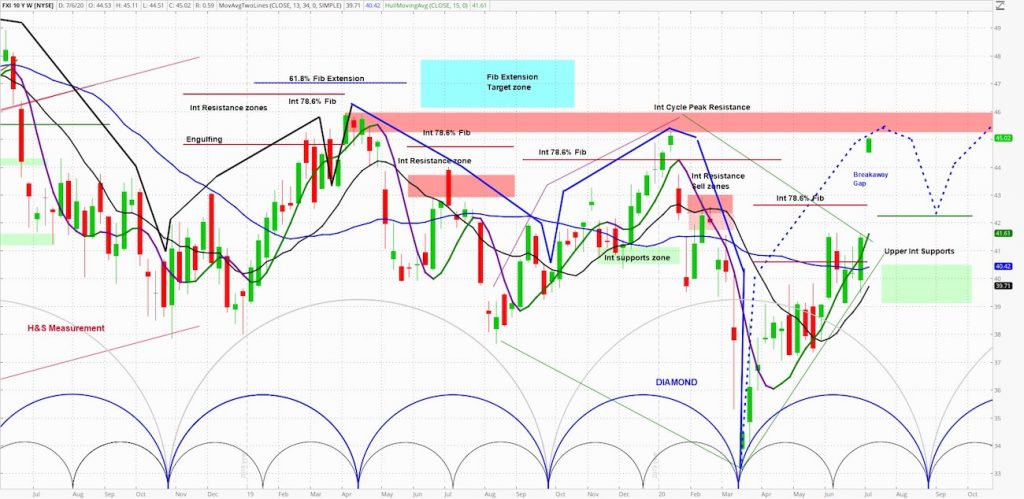
iShares China Large Cap ETF (FXI) Weekly Chart
askSlim Technical Briefing:
The weekly analysis suggests that FXI is in a positively configured cycle.
The next projected low is due in the middle-to-end of August. Weekly momentum is firmly positive.
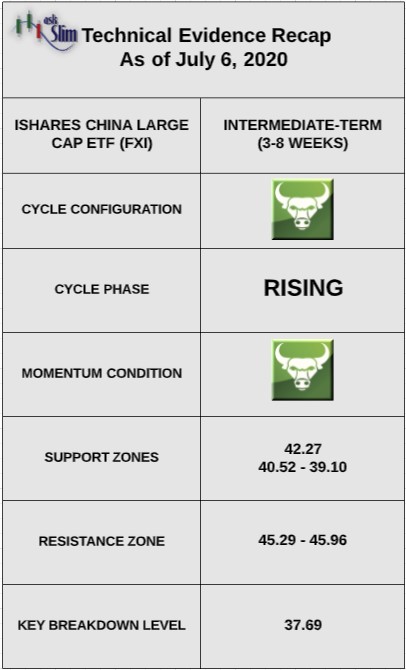
On the upside, there are prior cycle high resistances from 45.29 – 45.96.
On the downside, there is a rising intermediate-term support at 42.27 followed by another zone of support from 40.52 – 39.10. For the bears to regain control of the intermediate-term, we would need to see a weekly close back below 37.69.
askSlim Sum of the Evidence:
FXI has a bullish weekly cycle pattern with positive momentum. Given these conditions, we would expect downside to be limited to the rising intermediate-term supports beginning at 42.
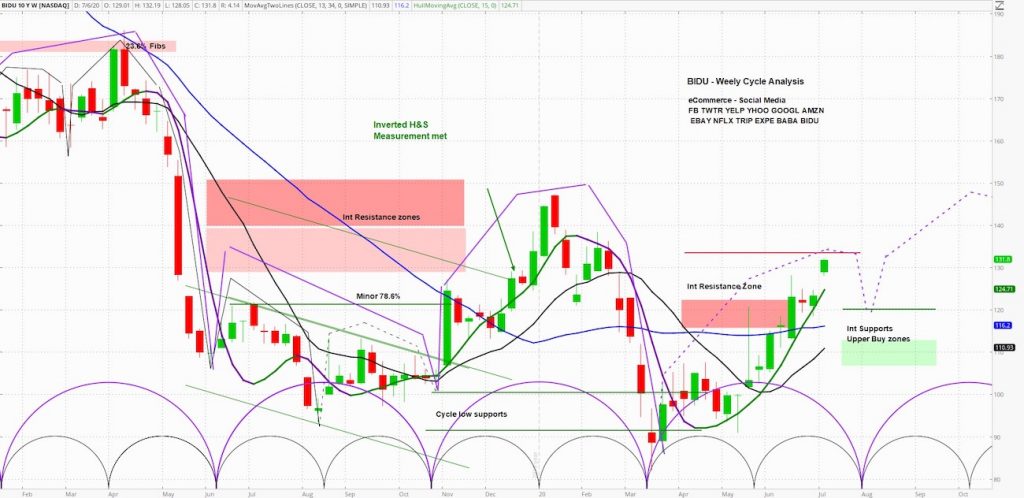
Baidu (BIDU) Weekly Chart
askSlim Technical Briefing:
The weekly cycle analysis suggests that BIDU is forming an important base.
The next projected intermediate-term low is due in early-to-mid August. Weekly momentum is positive.
On the upside, there is an intermediate-term Fibonacci resistance at 133.39.
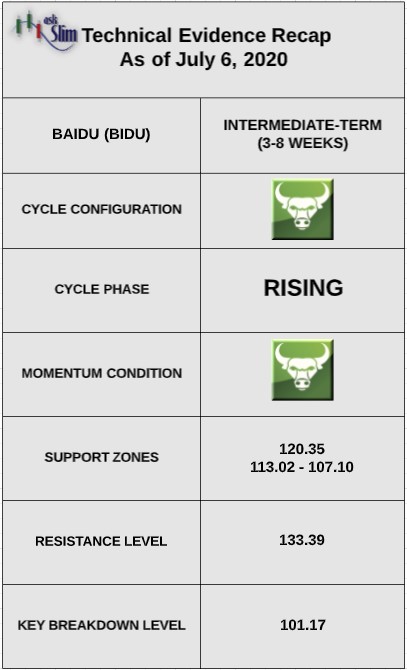
On the downside, there is a rising intermediate-term support at 120.35 followed by another zone of support from 113.02 – 107.10.
For the bears to regain control of the intermediate-term, we would need to see a weekly close back below 101.17.
askSlim Sum of the Evidence:
BIDU has a bullish weekly cycle pattern with positive momentum. Given these conditions, we would expect any downside to be limited to the rising intermediate-term supports beginning at 120.
Interested in askSlim?
Get professional grade technical analysis, trader education and trade planning tools at askSlim.com. Write to matt@askslim.com and mention See It Market in your email for special askSlim membership trial offers!
Twitter: @askslim
Any opinions expressed herein are solely those of the author, and do not in any way represent the views or opinions of any other person or entity.
 Current Price Analysis and Future Considerations")


 Current Price Analysis and Future Considerations")