On Tuesday after the close, Cheesecake Factory (CAKE) provided a business update.
The company announced they have re-opened about 25% of their dining rooms.
In addition, the re-opened Cheesecake Factory restaurants are running at approximately 75% of last year’s sales levels.
CAKE expects to have 65% of the company’s dining rooms re-opened (with limited capacity) by mid-June.
Investors celebrated the news and sent Cheesecake Factory’s stock (CAKE) up 17% on the day.
Let’s review the weekly cycle analysis.
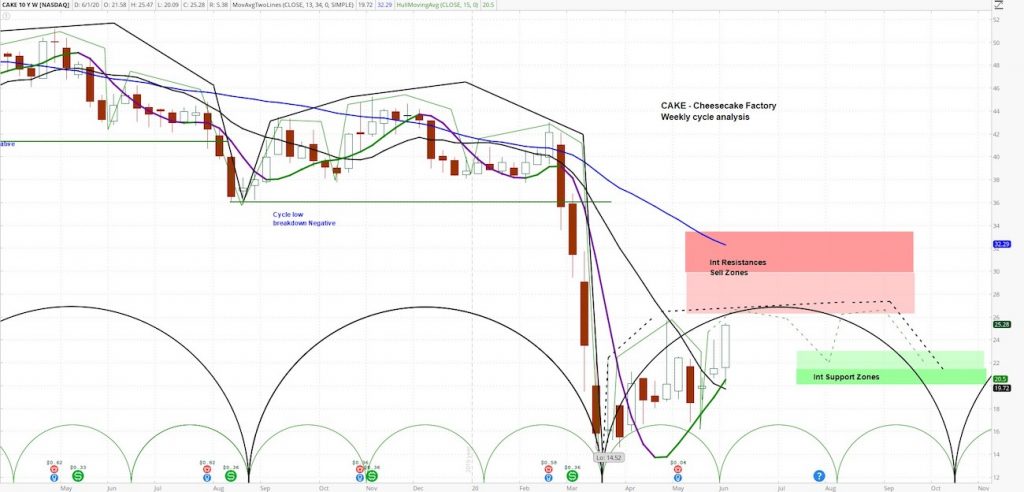
Cheesecake Factory (CAKE) Weekly Chart

At askSlim we use technical analysis to evaluate price charts of stocks, futures, and ETF’s. We use a combination of cycle, trend and momentum chart studies, on multiple timeframes, to present a “sum of the evidence” directional outlook in time and price.
askSlim Technical Briefing:

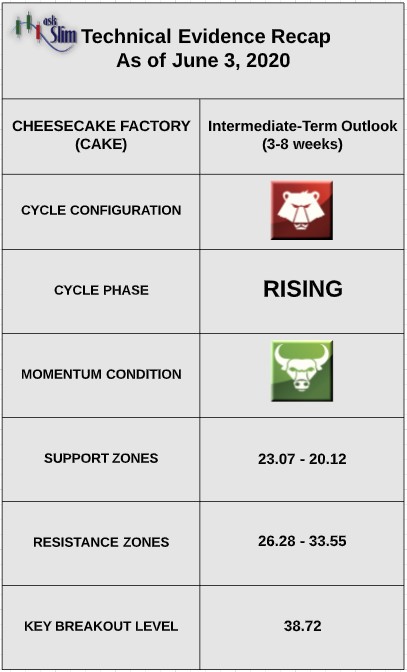
The weekly cycle analysis suggests that CAKE is in a rising phase in an overall bearish weekly cycle pattern. Weekly momentum is positive. The next projected intermediate-term low is due in mid-October.
On the upside, there are Fibonacci resistance zones from 26.28 – 33.55.
On the downside, there are intermediate-term supports from 23.07 – 20.12. For the bulls to gain control of the intermediate-term, we would need to see a weekly close above 38.72.
askSlim Sum of the Evidence:
CAKE sold off 66% between the middle of February and the middle of March. Given this over-extension on the downside, the analysis suggests that the stock will likely trade in a range for an extended period of time. We would expect the stock to trade between 22 – 27 through mid-October.
Interested in askSlim?
Get professional grade technical analysis, trader education and trade planning tools at askSlim.com. Write to matt@askslim.com and mention See It Market in your email for special askSlim membership trial offers!
Twitter: @askslim
Any opinions expressed herein are solely those of the author, and do not in any way represent the views or opinions of any other person or entity.


