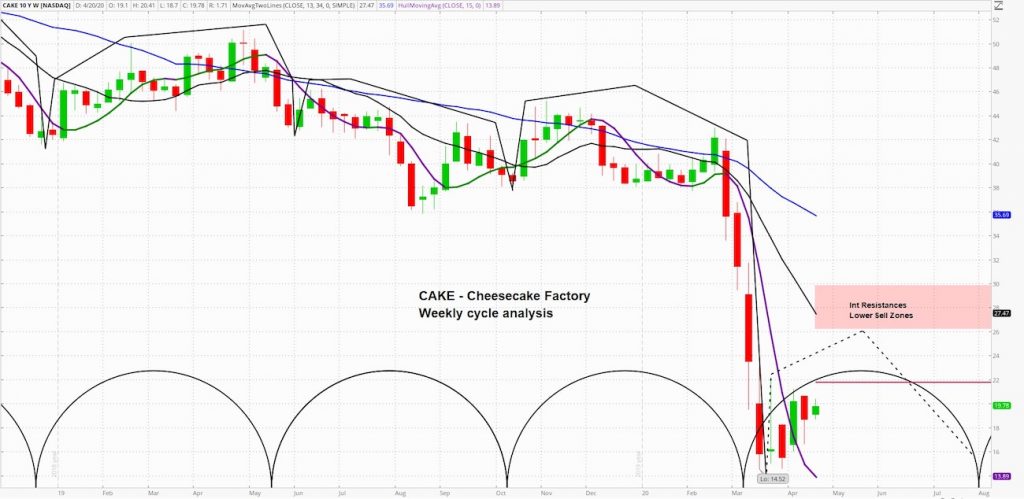
Cheesecake Factory (CAKE) Weekly Chart
On Monday morning, Cheesecake Factory NASDAQ: CAKE announced that Roark Capital invested $200M in the company in the form of a convertible preferred investment.
CEO David Overton noted that the investment was critical to enhance the company’s liquidity position.
The stock rallied almost 6% on the day.
Given this background, let’s see what the charts tell us.
At askSlim we use technical analysis to evaluate price charts of stocks, futures, and ETF’s. We use a combination of cycle, trend and momentum chart studies, on multiple timeframes, to present a “sum of the evidence” directional outlook in time and price.
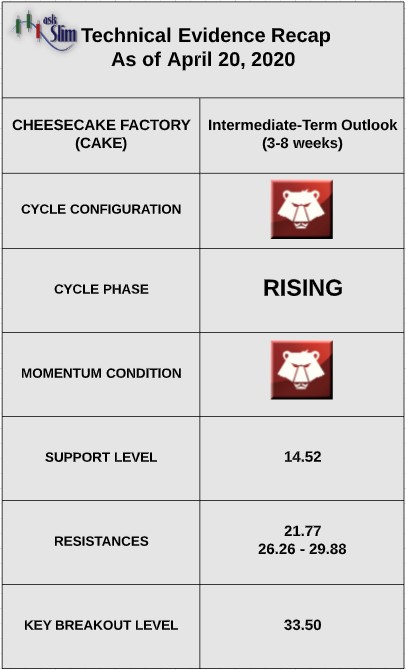
askSlim Technical Briefing: The weekly cycle analysis suggests that CAKE is in an intermediate-term rising phase in a very negative long-term pattern. The next projected intermediate-term low is due in early August. Weekly momentum is negative.

On the upside, there is an intermediate-term Fibonacci resistance at 21.77 followed by another zone of resistance from 26.26 – 29.88.
On the downside, the only visible support is the recent 10-year low at 14.52. For the bulls to regain control of the intermediate-term, we would need to see a weekly close above 33.50 to repair some of the damage down on the downside.
askSlim Sum of the Evidence: CAKE is in an intermediate-term rising phase with negative momentum. Given these conditions, we would expect CAKE to rally up to the intermediate-term resistances beginning at 21.77 before seeing a reversal to the downside.
Interested in askSlim?
Get professional grade technical analysis, trader education and trade planning tools at askSlim.com. Write to matt@askslim.com and mention See It Market in your email for special askSlim membership trial offers!
Twitter: @askslim
Any opinions expressed herein are solely those of the author, and do not in any way represent the views or opinions of any other person or entity.


