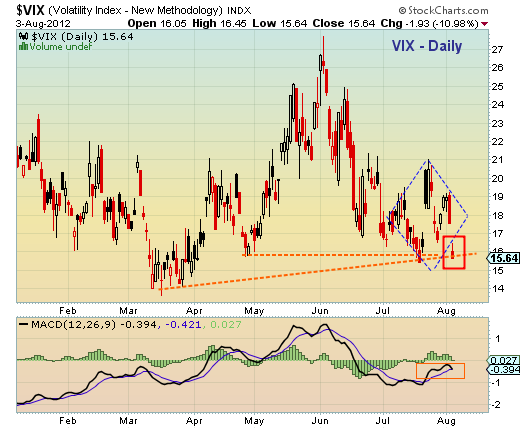
 The Volatility Index (VIX) dropped dramatically on Friday as equities leaped higher. It is currently near sitting tenuously on support, but looking likely to retest the March lows.
Any break lower would favor the near-term bullish thesis.
Volatility Index (VIX) technical chart with support and resistance levels and trend lines. VIX technical chart analysis. The VIX is a measure of stock market volatility.
Twitter: @andrewnyquist and @seeitmarket Facebook: See It Market
No position in any of the securities mentioned at the time of publication.
Any opinions expressed herein are solely those of the author, and do not in any way represent the views or opinions of his employer or any other person or entity.


