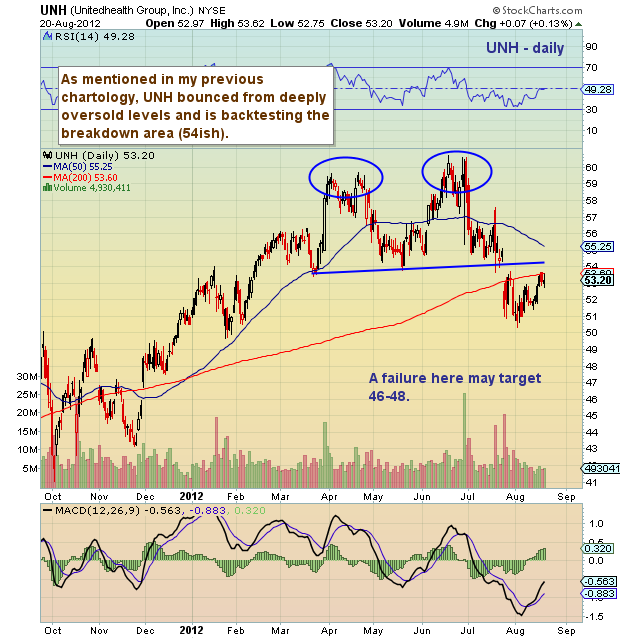
 In my July 27th Chartology on Unitedhealth Group (UNH), I mentioned that the stock was oversold and ready for a bounce, possibly to backtest the double top neckline around 54. Well the bounce has come on cue and the stock is now in full backtest mode. A failure here and the 46-48 target will be back on the table.
More charts found here.
Unitedhealth Group (UNH) stock chart with technical analysis overlay as of August 20, 2012. UNH Price support and resistance levels with analysis. UNH stock chart with head and shoulders pattern and break down below neck line. UNH technical analysis.
———————————————————
Twitter: @andrewnyquist and @seeitmarket Facebook: See It Market
No position in any of the securities mentioned at the time of publication.
Any opinions expressed herein are solely those of the author, and do not in any way represent the views or opinions of his employer or any other person or entity.


